|
Download Data (XLS File) |
|
||||||||
|
||||||||
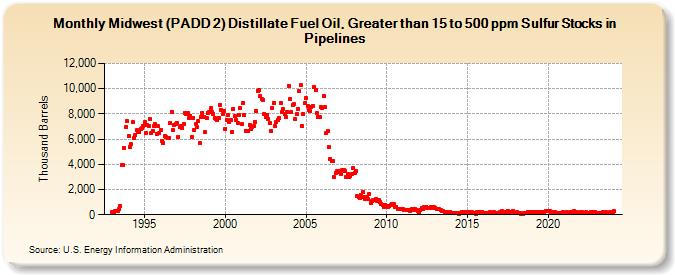
| Midwest (PADD 2) Distillate Fuel Oil, Greater than 15 to 500 ppm Sulfur Stocks in Pipelines (Thousand Barrels) | ||||||||
| Year | Jan | Feb | Mar | Apr | May | Jun | Jul | Aug | Sep | Oct | Nov | Dec |
|---|---|---|---|---|---|---|---|---|---|---|---|---|
| 1993 | 186 | 192 | 297 | 288 | 273 | 428 | 669 | 3,972 | 3,913 | 5,286 | 6,980 | 7,409 |
| 1994 | 6,246 | 5,375 | 5,577 | 7,341 | 6,060 | 6,298 | 6,693 | 6,553 | 6,570 | 6,820 | 6,897 | 7,021 |
| 1995 | 7,354 | 6,488 | 7,103 | 7,072 | 7,559 | 6,467 | 6,648 | 7,024 | 7,166 | 6,411 | 7,018 | 6,482 |
| 1996 | 6,735 | 5,883 | 5,660 | 6,272 | 6,163 | 6,100 | 6,120 | 7,280 | 8,180 | 6,693 | 7,124 | 7,167 |
| 1997 | 7,303 | 6,182 | 6,939 | 7,022 | 6,910 | 7,185 | 8,089 | 8,011 | 8,102 | 7,711 | 7,861 | 6,167 |
| 1998 | 7,706 | 6,757 | 7,189 | 6,950 | 7,410 | 5,681 | 7,738 | 8,108 | 7,776 | 6,537 | 7,668 | 8,094 |
| 1999 | 8,170 | 8,452 | 8,129 | 8,014 | 7,694 | 7,593 | 7,500 | 7,697 | 8,741 | 8,339 | 7,975 | 8,228 |
| 2000 | 6,833 | 7,541 | 7,943 | 7,357 | 7,542 | 6,597 | 8,414 | 7,798 | 7,519 | 7,270 | 7,921 | 8,438 |
| 2001 | 7,164 | 8,848 | 7,896 | 6,676 | 6,657 | 6,677 | 7,157 | 6,782 | 6,932 | 7,071 | 7,382 | 8,224 |
| 2002 | 9,816 | 9,866 | 9,405 | 9,158 | 9,093 | 8,010 | 7,724 | 7,945 | 7,604 | 7,257 | 6,642 | 8,445 |
| 2003 | 8,896 | 7,027 | 7,368 | 7,545 | 7,663 | 8,879 | 8,155 | 8,405 | 7,967 | 7,726 | 8,142 | 10,237 |
| 2004 | 9,175 | 8,121 | 8,681 | 8,793 | 7,572 | 7,980 | 8,426 | 9,790 | 10,266 | 7,027 | 7,998 | 8,843 |
| 2005 | 9,290 | 8,600 | 8,324 | 8,213 | 8,579 | 8,654 | 10,116 | 9,867 | 8,047 | 7,769 | 7,718 | 8,518 |
| 2006 | 8,490 | 9,412 | 8,522 | 6,481 | 6,610 | 5,390 | 4,415 | 4,264 | 4,268 | 2,966 | 3,340 | 3,440 |
| 2007 | 3,363 | 3,447 | 3,192 | 3,527 | 3,551 | 3,465 | 2,986 | 3,222 | 2,981 | 3,105 | 3,191 | 3,731 |
| 2008 | 3,331 | 3,508 | 1,456 | 1,383 | 1,322 | 1,600 | 1,771 | 1,376 | 1,277 | 1,381 | 1,242 | 1,648 |
| 2009 | 969 | 1,087 | 1,200 | 1,147 | 1,238 | 1,050 | 1,147 | 1,014 | 874 | 782 | 598 | 764 |
| 2010 | 689 | 607 | 694 | 769 | 864 | 813 | 626 | 635 | 462 | 442 | 432 | 473 |
| 2011 | 445 | 388 | 372 | 412 | 339 | 296 | 402 | 470 | 376 | 476 | 410 | 314 |
| 2012 | 236 | 375 | 519 | 452 | 650 | 648 | 499 | 551 | 519 | 580 | 509 | 640 |
| 2013 | 555 | 436 | 464 | 432 | 352 | 333 | 259 | 231 | 194 | 238 | 192 | 231 |
| 2014 | 102 | 107 | 156 | 148 | 143 | 133 | 85 | 120 | 176 | 180 | 209 | 191 |
| 2015 | 186 | 159 | 217 | 231 | 144 | 148 | 70 | 193 | 192 | 224 | 120 | 241 |
| 2016 | 103 | 152 | 105 | 118 | 173 | 250 | 123 | 157 | 206 | 100 | 114 | 136 |
| 2017 | 191 | 245 | 274 | 164 | 251 | 229 | 305 | 160 | 252 | 248 | 283 | 113 |
| 2018 | 165 | 194 | 110 | 163 | 84 | 87 | 155 | 109 | 139 | 240 | 168 | 253 |
| 2019 | 188 | 179 | 233 | 186 | 192 | 201 | 193 | 190 | 236 | 189 | 286 | 305 |
| 2020 | 289 | 267 | 249 | 207 | 156 | 211 | 163 | 156 | 169 | 142 | 162 | 176 |
| 2021 | 130 | 168 | 183 | 129 | 173 | 177 | 238 | 298 | 248 | 214 | 117 | 127 |
| 2022 | 186 | 188 | 108 | 112 | 204 | 175 | 121 | 158 | 178 | 182 | 165 | 245 |
| 2023 | 167 | 145 | 124 | 134 | 160 | 191 | 121 | 179 | 171 | 153 | 206 | 188 |
| 2024 | 205 | |||||||||||
| - = No Data Reported; -- = Not Applicable; NA = Not Available; W = Withheld to avoid disclosure of individual company data. |
| Release Date: 3/29/2024 |
| Next Release Date: 4/30/2024 |