|
Download Data (XLS File) |
|
||||||||
|
||||||||
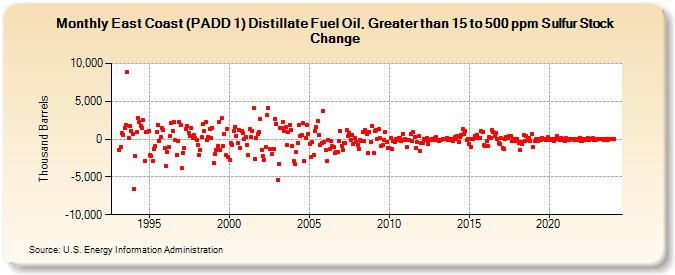
| East Coast (PADD 1) Distillate Fuel Oil, Greater than 15 to 500 ppm Sulfur Stock Change (Thousand Barrels) | ||||||||
| Year | Jan | Feb | Mar | Apr | May | Jun | Jul | Aug | Sep | Oct | Nov | Dec |
|---|---|---|---|---|---|---|---|---|---|---|---|---|
| 1993 | -1,482 | -1,041 | 804 | 592 | 1,415 | 1,851 | 8,833 | 94 | 1,763 | 1,023 | 661 | |
| 1994 | -6,618 | -2,252 | 1,004 | 2,819 | 2,236 | 1,764 | 1,482 | 2,494 | -2,907 | 878 | 960 | 1,032 |
| 1995 | -2,123 | -2,269 | -2,836 | -1,338 | -929 | 912 | 1,929 | -313 | 273 | 1,495 | 1,166 | -1,165 |
| 1996 | -3,497 | -1,677 | -1,085 | 468 | 2,064 | 1,093 | 2,317 | -159 | -2,109 | -187 | 2,304 | 1,925 |
| 1997 | -3,863 | -1,816 | -1,199 | 1,316 | 1,751 | 870 | 416 | 1,486 | 103 | 551 | 146 | -177 |
| 1998 | -736 | -2,140 | -1,499 | 265 | 1,973 | 1,095 | 2,291 | -81 | 282 | 1,330 | 200 | 1,525 |
| 1999 | -3,108 | -2,007 | -1,425 | -909 | 2,300 | -1,408 | 2,747 | -917 | 699 | -2,093 | 1,337 | -2,321 |
| 2000 | -2,742 | -564 | -715 | 1,025 | 1,570 | 462 | -505 | 1,269 | -1,142 | 1,073 | 749 | -39 |
| 2001 | 228 | -774 | -2,109 | 1,275 | 261 | 1,071 | 4,050 | -2,622 | 170 | 685 | 956 | 2,625 |
| 2002 | -1,382 | -2,207 | -2,784 | -1,077 | 3,162 | 4,088 | -1,292 | -1,249 | -1,919 | -1,286 | 2,641 | 1,970 |
| 2003 | -5,389 | -3,290 | 1,510 | 1,407 | 2,302 | 1,111 | 1,545 | -749 | 964 | 1,876 | 1,258 | -932 |
| 2004 | -2,901 | -3,346 | -1,728 | -498 | 1,870 | 407 | 544 | 2,160 | -2,897 | 83 | 1,872 | 721 |
| 2005 | -624 | -2,338 | -432 | -2,041 | 1,017 | 1,626 | 2,382 | 588 | -774 | -460 | 3,669 | -335 |
| 2006 | -1,456 | -2,957 | -74 | -1,367 | -214 | -853 | -1,055 | -1,888 | -1,664 | -1,666 | -192 | 1,090 |
| 2007 | -867 | -1,503 | -487 | -492 | 1,217 | 396 | 831 | -106 | 583 | -694 | 116 | -434 |
| 2008 | -756 | -1,333 | -147 | -312 | 1,000 | -262 | 1,214 | 739 | -1,850 | 984 | -404 | 1,776 |
| 2009 | -1,839 | 1,079 | 1,175 | -49 | 1,276 | 146 | -963 | -721 | -60 | 874 | -344 | -1,206 |
| 2010 | -1,121 | 155 | -1,363 | -191 | -355 | 19 | -90 | 200 | 122 | -207 | 680 | -86 |
| 2011 | -52 | -1,085 | -67 | -164 | 656 | -295 | 905 | 267 | -1,154 | -397 | 429 | -1,510 |
| 2012 | -528 | -517 | -30 | -54 | 142 | -647 | -150 | -80 | 23 | -164 | 208 | 268 |
| 2013 | -174 | -192 | -84 | -74 | 25 | -28 | -41 | 164 | -90 | 51 | -60 | -50 |
| 2014 | -223 | 219 | 29 | 350 | -329 | 237 | 484 | 1,399 | 633 | 1,024 | -102 | 15 |
| 2015 | -679 | -1,092 | 59 | 57 | 389 | 128 | 595 | 191 | 158 | 1,093 | 904 | -721 |
| 2016 | -932 | -187 | -899 | 215 | 139 | 1,202 | 937 | 357 | 762 | 5 | -471 | -597 |
| 2017 | 141 | -1,118 | -1,303 | 66 | 237 | 110 | 395 | 443 | -309 | 43 | -250 | 41 |
| 2018 | -45 | -466 | -1,418 | -332 | -604 | 495 | -216 | 397 | -109 | 84 | -268 | 671 |
| 2019 | -1,098 | -222 | -30 | 55 | -205 | -16 | -71 | 196 | -41 | 76 | -162 | 226 |
| 2020 | -123 | -130 | 76 | 75 | -186 | -40 | 363 | -26 | -118 | 146 | 16 | -107 |
| 2021 | -291 | 99 | -140 | -54 | -3 | 47 | -8 | -100 | -19 | 65 | -69 | 162 |
| 2022 | -194 | -199 | 8 | -74 | 5 | 170 | -122 | -9 | 56 | 109 | -71 | -123 |
| 2023 | 7 | -18 | 43 | -34 | 48 | -125 | 22 | 34 | -60 | 22 | 73 | -51 |
| 2024 | -16 | |||||||||||
| - = No Data Reported; -- = Not Applicable; NA = Not Available; W = Withheld to avoid disclosure of individual company data. |
| Release Date: 3/29/2024 |
| Next Release Date: 4/30/2024 |