|
Download Data (XLS File) |
|
||||||||
|
||||||||
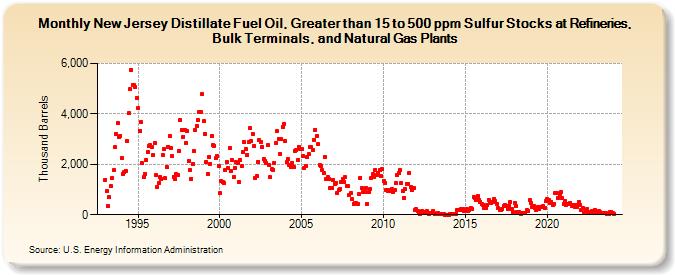
| New Jersey Distillate Fuel Oil, Greater than 15 to 500 ppm Sulfur Stocks at Refineries, Bulk Terminals, and Natural Gas Plants (Thousand Barrels) | ||||||||
| Year | Jan | Feb | Mar | Apr | May | Jun | Jul | Aug | Sep | Oct | Nov | Dec |
|---|---|---|---|---|---|---|---|---|---|---|---|---|
| 1993 | 1,394 | 928 | 342 | 686 | 1,135 | 1,459 | 1,763 | 2,670 | 3,201 | 3,634 | 3,085 | 3,133 |
| 1994 | 2,248 | 1,609 | 1,694 | 1,744 | 2,919 | 4,024 | 4,980 | 5,741 | 5,142 | 5,136 | 5,058 | 4,645 |
| 1995 | 4,220 | 3,329 | 3,663 | 2,043 | 1,486 | 1,621 | 2,165 | 2,497 | 2,712 | 2,750 | 2,672 | 2,353 |
| 1996 | 2,836 | 1,557 | 1,110 | 1,245 | 1,502 | 1,415 | 2,381 | 2,588 | 1,442 | 1,881 | 2,697 | 3,128 |
| 1997 | 2,645 | 2,315 | 1,516 | 1,417 | 1,606 | 1,573 | 2,536 | 3,759 | 3,361 | 3,103 | 3,357 | 2,837 |
| 1998 | 3,320 | 2,138 | 1,780 | 1,428 | 2,016 | 2,525 | 3,365 | 3,539 | 3,750 | 4,059 | 4,064 | 4,770 |
| 1999 | 3,699 | 3,212 | 2,104 | 1,635 | 2,290 | 2,022 | 3,126 | 2,760 | 2,745 | 2,240 | 2,311 | 1,930 |
| 2000 | 843 | 1,327 | 1,307 | 1,263 | 1,768 | 2,087 | 1,873 | 2,663 | 1,752 | 2,189 | 1,497 | 1,871 |
| 2001 | 2,081 | 2,036 | 1,297 | 2,168 | 1,914 | 2,481 | 2,868 | 2,592 | 2,388 | 2,887 | 3,432 | 2,924 |
| 2002 | 3,215 | 2,740 | 1,447 | 1,526 | 2,111 | 2,950 | 2,904 | 2,692 | 2,203 | 2,140 | 2,053 | 2,751 |
| 2003 | 1,976 | 1,478 | 1,800 | 1,791 | 2,066 | 2,837 | 3,302 | 3,012 | 2,423 | 2,987 | 3,496 | 3,615 |
| 2004 | 2,909 | 2,073 | 2,196 | 1,953 | 1,895 | 2,048 | 1,888 | 2,528 | 2,561 | 2,151 | 2,696 | 2,616 |
| 2005 | 2,595 | 2,317 | 1,870 | 1,945 | 2,300 | 2,397 | 2,700 | 2,686 | 2,583 | 2,983 | 3,378 | 3,131 |
| 2006 | 2,804 | 1,961 | 1,914 | 1,756 | 1,654 | 2,298 | 1,404 | 1,500 | 1,422 | 1,070 | 1,047 | 1,395 |
| 2007 | 1,217 | 1,254 | 843 | 961 | 1,031 | 1,301 | 1,400 | 1,303 | 1,477 | 1,155 | 1,138 | 782 |
| 2008 | 853 | 611 | 437 | 459 | 463 | 440 | 811 | 1,473 | 1,042 | 916 | 920 | 1,062 |
| 2009 | 430 | 907 | 1,025 | 1,446 | 1,602 | 1,496 | 1,792 | 1,587 | 1,643 | 1,765 | 1,554 | 1,802 |
| 2010 | 1,324 | 1,252 | 987 | 946 | 963 | 934 | 1,001 | 910 | 996 | 1,239 | 1,587 | 1,664 |
| 2011 | 1,755 | 1,266 | 955 | 674 | 1,016 | 1,232 | 1,236 | 1,673 | 1,088 | 982 | 1,048 | 175 |
| 2012 | 208 | 143 | 104 | 43 | 146 | 92 | 97 | 88 | 137 | 48 | 77 | 77 |
| 2013 | 143 | 69 | 46 | 35 | 61 | 15 | 25 | 9 | 8 | 8 | 5 | |
| 2014 | 4 | 10 | 10 | 11 | 46 | 175 | 188 | 199 | 246 | 221 | 161 | |
| 2015 | 204 | 244 | 152 | 200 | 277 | 228 | 702 | 677 | 574 | 736 | 580 | 520 |
| 2016 | 436 | 403 | 257 | 265 | 384 | 595 | 515 | 464 | 489 | 627 | 550 | 438 |
| 2017 | 254 | 203 | 175 | 235 | 360 | 404 | 355 | 210 | 356 | 506 | 235 | 112 |
| 2018 | 478 | 354 | 99 | 103 | 87 | 48 | 54 | 79 | 58 | 169 | 162 | 580 |
| 2019 | 455 | 311 | 361 | 265 | 184 | 293 | 219 | 322 | 312 | 331 | 263 | 531 |
| 2020 | 629 | 581 | 470 | 516 | 395 | 439 | 842 | 859 | 660 | 800 | 886 | 674 |
| 2021 | 431 | 553 | 394 | 429 | 444 | 465 | 354 | 366 | 316 | 373 | 322 | 517 |
| 2022 | 377 | 206 | 254 | 86 | 100 | 228 | 114 | 117 | 109 | 146 | 127 | 187 |
| 2023 | 77 | 118 | 129 | 107 | 61 | 61 | 56 | 54 | 33 | 39 | 106 | 117 |
| 2024 | 55 | 45 | ||||||||||
| - = No Data Reported; -- = Not Applicable; NA = Not Available; W = Withheld to avoid disclosure of individual company data. |
| Release Date: 4/30/2024 |
| Next Release Date: 5/31/2024 |