|
Download Data (XLS File) |
|
||||||||
|
||||||||
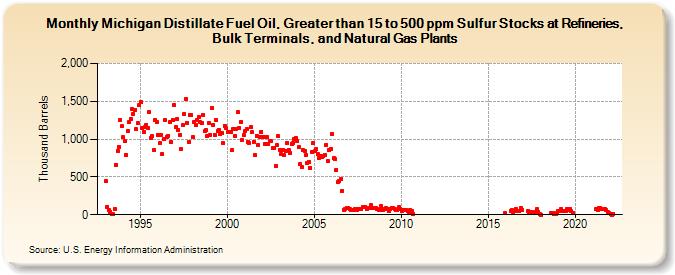
| Michigan Distillate Fuel Oil, Greater than 15 to 500 ppm Sulfur Stocks at Refineries, Bulk Terminals, and Natural Gas Plants (Thousand Barrels) | ||||||||
| Year | Jan | Feb | Mar | Apr | May | Jun | Jul | Aug | Sep | Oct | Nov | Dec |
|---|---|---|---|---|---|---|---|---|---|---|---|---|
| 1993 | 444 | 102 | 59 | 36 | 4 | 6 | 75 | 663 | 845 | 899 | 1,253 | 1,167 |
| 1994 | 1,024 | 971 | 791 | 1,110 | 1,229 | 1,268 | 1,404 | 1,338 | 1,391 | 1,127 | 1,207 | 1,446 |
| 1995 | 1,490 | 1,151 | 1,100 | 1,159 | 1,184 | 1,153 | 1,356 | 1,020 | 1,036 | 857 | 1,252 | 1,225 |
| 1996 | 1,051 | 948 | 1,060 | 805 | 1,002 | 1,250 | 1,032 | 1,045 | 1,225 | 961 | 1,255 | 1,454 |
| 1997 | 1,161 | 1,266 | 1,123 | 1,058 | 864 | 1,185 | 1,335 | 1,531 | 1,214 | 962 | 1,324 | 1,318 |
| 1998 | 1,024 | 1,225 | 1,181 | 1,249 | 1,289 | 1,221 | 1,208 | 1,321 | 1,101 | 1,120 | 1,045 | 1,215 |
| 1999 | 1,056 | 1,409 | 1,190 | 1,059 | 1,247 | 1,109 | 1,125 | 1,065 | 1,075 | 944 | 1,177 | 1,142 |
| 2000 | 1,093 | 1,095 | 1,095 | 855 | 1,140 | 1,038 | 1,140 | 1,353 | 1,146 | 1,227 | 989 | 1,054 |
| 2001 | 1,104 | 1,134 | 966 | 948 | 1,156 | 1,090 | 966 | 786 | 1,047 | 917 | 1,028 | 1,097 |
| 2002 | 1,030 | 1,026 | 940 | 1,033 | 938 | 977 | 973 | 877 | 888 | 646 | 917 | 1,036 |
| 2003 | 853 | 802 | 856 | 791 | 845 | 952 | 862 | 815 | 940 | 942 | 999 | 1,020 |
| 2004 | 973 | 897 | 670 | 631 | 852 | 846 | 789 | 679 | 701 | 620 | 833 | 942 |
| 2005 | 843 | 871 | 799 | 754 | 774 | 764 | 771 | 794 | 926 | 704 | 851 | 873 |
| 2006 | 1,070 | 746 | 731 | 596 | 431 | 452 | 469 | 315 | 67 | 76 | 83 | 92 |
| 2007 | 71 | 62 | 65 | 62 | 74 | 60 | 73 | 81 | 71 | 100 | 97 | 108 |
| 2008 | 69 | 90 | 93 | 125 | 93 | 83 | 86 | 81 | 67 | 59 | 114 | 66 |
| 2009 | 69 | 84 | 77 | 44 | 75 | 90 | 94 | 77 | 63 | 64 | 96 | 80 |
| 2010 | 47 | 57 | 57 | 65 | 52 | 32 | 64 | 46 | 10 | |||
| 2015 | 19 | |||||||||||
| 2016 | 46 | 62 | 40 | 49 | 74 | 54 | 54 | 86 | 63 | |||
| 2017 | 53 | 42 | 36 | 20 | 27 | 39 | 69 | 33 | 7 | |||
| 2018 | 2 | 17 | 26 | 4 | 6 | 26 | ||||||
| 2019 | 47 | 47 | 76 | 50 | 54 | 53 | 71 | 65 | 73 | 44 | 24 | |
| 2021 | 72 | 65 | 86 | 84 | 82 | 80 | 74 | 59 | 39 | 19 | ||
| 2022 | 9 | 1 | 14 | |||||||||
| - = No Data Reported; -- = Not Applicable; NA = Not Available; W = Withheld to avoid disclosure of individual company data. |
| Release Date: 3/29/2024 |
| Next Release Date: 4/30/2024 |