|
Download Data (XLS File) |
|
||||||||
|
||||||||
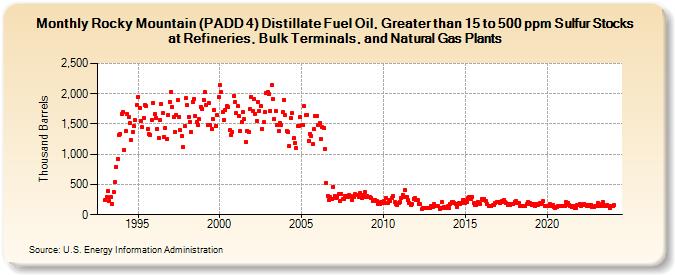
| Rocky Mountain (PADD 4) Distillate Fuel Oil, Greater than 15 to 500 ppm Sulfur Stocks at Refineries, Bulk Terminals, and Natural Gas Plants (Thousand Barrels) | ||||||||
| Year | Jan | Feb | Mar | Apr | May | Jun | Jul | Aug | Sep | Oct | Nov | Dec |
|---|---|---|---|---|---|---|---|---|---|---|---|---|
| 1993 | 249 | 296 | 388 | 224 | 294 | 181 | 382 | 535 | 791 | 923 | 1,312 | 1,335 |
| 1994 | 1,671 | 1,696 | 1,075 | 1,386 | 1,664 | 1,612 | 1,512 | 1,240 | 1,370 | 1,460 | 1,561 | 1,814 |
| 1995 | 1,953 | 1,772 | 1,555 | 1,443 | 1,593 | 1,815 | 1,795 | 1,419 | 1,327 | 1,323 | 1,566 | 1,850 |
| 1996 | 1,658 | 1,604 | 1,419 | 1,266 | 1,568 | 1,827 | 1,681 | 1,291 | 1,439 | 1,249 | 1,647 | 1,871 |
| 1997 | 2,034 | 1,786 | 1,622 | 1,370 | 1,654 | 1,892 | 1,622 | 1,395 | 1,306 | 1,115 | 1,460 | 1,922 |
| 1998 | 1,808 | 1,623 | 1,536 | 1,366 | 1,863 | 1,912 | 1,630 | 1,530 | 1,482 | 1,575 | 1,781 | 1,749 |
| 1999 | 1,902 | 2,023 | 1,812 | 1,490 | 1,845 | 1,478 | 1,421 | 1,577 | 1,723 | 1,460 | 1,646 | 1,944 |
| 2000 | 2,137 | 2,035 | 1,698 | 1,573 | 1,729 | 1,804 | 1,775 | 1,400 | 1,320 | 1,367 | 1,964 | 1,865 |
| 2001 | 1,675 | 1,790 | 1,626 | 1,389 | 1,533 | 1,690 | 1,577 | 1,210 | 1,392 | 1,375 | 1,745 | 1,943 |
| 2002 | 1,711 | 1,910 | 1,669 | 1,557 | 1,868 | 1,717 | 1,801 | 1,425 | 1,525 | 1,694 | 2,004 | 2,032 |
| 2003 | 1,992 | 1,716 | 2,144 | 1,918 | 1,583 | 1,708 | 1,476 | 1,382 | 1,524 | 1,491 | 1,697 | 1,900 |
| 2004 | 1,647 | 1,392 | 1,366 | 1,140 | 1,601 | 1,681 | 1,261 | 1,187 | 1,105 | 1,463 | 1,468 | 1,622 |
| 2005 | 1,477 | 1,481 | 1,793 | 1,644 | 1,650 | 1,224 | 1,340 | 1,309 | 1,166 | 1,413 | 1,637 | 1,626 |
| 2006 | 1,489 | 1,514 | 1,257 | 1,443 | 1,433 | 1,087 | 521 | 315 | 246 | 291 | 266 | 465 |
| 2007 | 313 | 280 | 291 | 341 | 225 | 349 | 258 | 267 | 303 | 308 | 289 | 323 |
| 2008 | 307 | 250 | 286 | 335 | 320 | 332 | 292 | 362 | 278 | 321 | 374 | 299 |
| 2009 | 309 | 295 | 286 | 274 | 231 | 237 | 240 | 222 | 183 | 183 | 204 | 188 |
| 2010 | 222 | 200 | 271 | 187 | 249 | 229 | 282 | 312 | 209 | 177 | 155 | 189 |
| 2011 | 215 | 279 | 331 | 299 | 401 | 301 | 236 | 199 | 154 | 183 | 267 | 277 |
| 2012 | 242 | 243 | 180 | 174 | 87 | 114 | 116 | 108 | 107 | 109 | 110 | 147 |
| 2013 | 132 | 171 | 137 | 139 | 138 | 101 | 104 | 208 | 131 | 105 | 105 | 139 |
| 2014 | 116 | 178 | 215 | 215 | 197 | 171 | 122 | 188 | 174 | 196 | 236 | 238 |
| 2015 | 195 | 215 | 270 | 301 | 266 | 291 | 191 | 153 | 154 | 210 | 199 | 185 |
| 2016 | 263 | 235 | 256 | 227 | 173 | 146 | 144 | 143 | 156 | 157 | 194 | 218 |
| 2017 | 208 | 188 | 208 | 232 | 245 | 210 | 197 | 166 | 178 | 162 | 178 | 170 |
| 2018 | 209 | 229 | 193 | 188 | 138 | 138 | 152 | 138 | 146 | 170 | 208 | 199 |
| 2019 | 179 | 157 | 170 | 140 | 177 | 167 | 170 | 191 | 182 | 219 | 144 | 136 |
| 2020 | 145 | 148 | 181 | 152 | 154 | 123 | 119 | 123 | 143 | 143 | 151 | 151 |
| 2021 | 139 | 143 | 208 | 200 | 167 | 150 | 120 | 144 | 114 | 118 | 153 | 163 |
| 2022 | 173 | 151 | 163 | 185 | 165 | 145 | 164 | 138 | 167 | 122 | 127 | 148 |
| 2023 | 147 | 188 | 136 | 143 | 176 | 203 | 150 | 138 | 163 | 151 | 115 | 147 |
| 2024 | 136 | |||||||||||
| - = No Data Reported; -- = Not Applicable; NA = Not Available; W = Withheld to avoid disclosure of individual company data. |
| Release Date: 3/29/2024 |
| Next Release Date: 4/30/2024 |