|
Download Data (XLS File) |
|
||||||||
|
||||||||
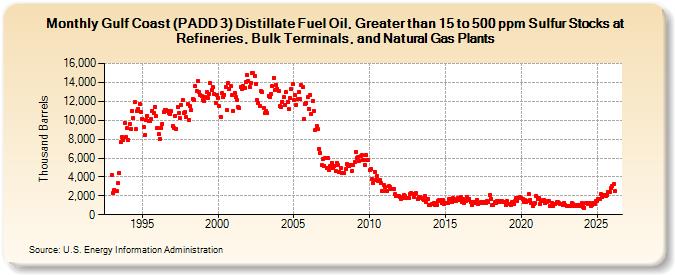
| Gulf Coast (PADD 3) Distillate Fuel Oil, Greater than 15 to 500 ppm Sulfur Stocks at Refineries, Bulk Terminals, and Natural Gas Plants (Thousand Barrels) | ||||||||
| Year | Jan | Feb | Mar | Apr | May | Jun | Jul | Aug | Sep | Oct | Nov | Dec |
|---|---|---|---|---|---|---|---|---|---|---|---|---|
| 1993 | 4,181 | 2,292 | 2,662 | 2,457 | 2,512 | 3,336 | 4,430 | 7,651 | 8,244 | 7,873 | 9,710 | 8,214 |
| 1994 | 9,145 | 7,931 | 9,637 | 9,092 | 11,021 | 10,253 | 11,906 | 9,030 | 11,016 | 11,221 | 11,706 | 10,889 |
| 1995 | 10,173 | 9,287 | 8,386 | 10,035 | 10,452 | 9,967 | 9,868 | 10,099 | 11,011 | 10,715 | 11,438 | 10,469 |
| 1996 | 9,213 | 8,495 | 8,037 | 9,224 | 9,624 | 10,919 | 11,065 | 11,076 | 11,000 | 10,709 | 10,650 | 10,924 |
| 1997 | 9,393 | 9,196 | 10,480 | 9,102 | 11,401 | 10,725 | 10,220 | 11,632 | 12,104 | 10,798 | 10,841 | 10,332 |
| 1998 | 11,663 | 10,042 | 11,454 | 11,076 | 12,257 | 12,167 | 13,573 | 13,096 | 14,155 | 12,944 | 12,629 | 12,541 |
| 1999 | 12,138 | 12,081 | 12,483 | 12,957 | 12,358 | 12,788 | 13,917 | 13,214 | 13,517 | 12,753 | 11,860 | 12,704 |
| 2000 | 12,393 | 11,469 | 10,359 | 12,829 | 12,412 | 12,707 | 13,533 | 11,087 | 13,909 | 13,300 | 13,634 | 12,638 |
| 2001 | 10,973 | 12,900 | 12,411 | 12,110 | 11,361 | 11,267 | 13,519 | 13,333 | 13,594 | 13,369 | 14,032 | 14,769 |
| 2002 | 14,147 | 13,545 | 13,963 | 15,017 | 14,971 | 14,700 | 13,847 | 12,173 | 11,844 | 11,507 | 13,046 | 12,969 |
| 2003 | 11,323 | 10,730 | 10,996 | 10,740 | 12,588 | 12,430 | 12,812 | 13,589 | 14,499 | 13,148 | 13,710 | 13,334 |
| 2004 | 13,137 | 11,525 | 11,382 | 11,956 | 12,419 | 11,558 | 12,935 | 11,949 | 11,170 | 12,353 | 13,288 | 13,796 |
| 2005 | 12,142 | 12,643 | 11,625 | 12,242 | 12,985 | 12,215 | 13,687 | 13,546 | 10,084 | 11,718 | 11,801 | 12,435 |
| 2006 | 11,205 | 12,685 | 10,637 | 12,041 | 10,988 | 8,978 | 9,405 | 9,027 | 6,979 | 6,541 | 5,232 | 5,888 |
| 2007 | 5,190 | 5,955 | 4,987 | 6,010 | 4,776 | 5,134 | 5,522 | 4,969 | 5,131 | 4,578 | 5,518 | 5,210 |
| 2008 | 4,530 | 4,894 | 4,384 | 4,416 | 4,413 | 4,828 | 5,336 | 5,230 | 5,103 | 5,261 | 4,671 | 5,220 |
| 2009 | 5,603 | 6,675 | 6,025 | 6,133 | 5,704 | 6,169 | 6,284 | 5,829 | 5,276 | 6,278 | 5,755 | 5,744 |
| 2010 | 4,702 | 4,800 | 3,824 | 3,345 | 4,555 | 3,685 | 4,050 | 3,530 | 3,703 | 3,369 | 2,460 | 3,165 |
| 2011 | 2,945 | 2,493 | 2,554 | 3,009 | 2,924 | 2,720 | 2,707 | 2,673 | 2,166 | 2,023 | 1,989 | 1,960 |
| 2012 | 1,892 | 1,690 | 1,783 | 2,076 | 1,932 | 1,763 | 1,756 | 1,806 | 2,192 | 2,339 | 2,201 | 1,907 |
| 2013 | 2,223 | 2,288 | 1,661 | 1,824 | 1,867 | 1,737 | 1,691 | 1,582 | 1,976 | 1,340 | 1,667 | 1,039 |
| 2014 | 1,016 | 1,142 | 1,096 | 1,259 | 1,066 | 1,054 | 1,438 | 1,506 | 1,564 | 1,218 | 1,545 | 1,114 |
| 2015 | 1,280 | 1,200 | 1,205 | 1,659 | 1,689 | 1,370 | 1,718 | 1,634 | 1,485 | 1,548 | 1,796 | 1,529 |
| 2016 | 1,841 | 1,332 | 1,631 | 1,245 | 1,494 | 1,834 | 1,514 | 1,685 | 1,345 | 1,020 | 1,388 | 1,234 |
| 2017 | 1,331 | 1,586 | 1,179 | 1,187 | 1,310 | 1,287 | 1,357 | 1,360 | 1,243 | 1,473 | 1,293 | 2,074 |
| 2018 | 1,651 | 1,025 | 1,060 | 1,316 | 1,253 | 1,446 | 1,404 | 1,362 | 1,446 | 1,412 | 1,376 | 1,367 |
| 2019 | 997 | 1,426 | 1,174 | 1,134 | 999 | 1,367 | 1,103 | 1,449 | 1,736 | 1,500 | 1,789 | 1,857 |
| 2020 | 1,800 | 1,627 | 1,363 | 1,586 | 1,306 | 1,401 | 2,155 | 1,580 | 1,207 | 971 | 1,103 | 1,248 |
| 2021 | 2,007 | 1,618 | 1,755 | 1,185 | 1,423 | 1,516 | 1,522 | 1,191 | 1,299 | 1,468 | 1,482 | 949 |
| 2022 | 1,206 | 907 | 1,153 | 1,085 | 1,296 | 1,328 | 1,258 | 1,156 | 1,145 | 1,032 | 1,257 | 1,031 |
| 2023 | 938 | 927 | 932 | 863 | 1,213 | 1,124 | 883 | 937 | 1,051 | 1,044 | 962 | 1,051 |
| 2024 | 1,237 | |||||||||||
| - = No Data Reported; -- = Not Applicable; NA = Not Available; W = Withheld to avoid disclosure of individual company data. |
| Release Date: 3/29/2024 |
| Next Release Date: 4/30/2024 |