|
Download Data (XLS File) |
|
||||||||
|
||||||||
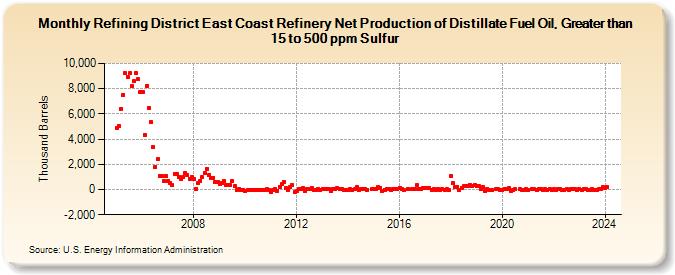
| Refining District East Coast Refinery Net Production of Distillate Fuel Oil, Greater than 15 to 500 ppm Sulfur (Thousand Barrels) | ||||||||
| Year | Jan | Feb | Mar | Apr | May | Jun | Jul | Aug | Sep | Oct | Nov | Dec |
|---|---|---|---|---|---|---|---|---|---|---|---|---|
| 2005 | 4,896 | 5,036 | 6,407 | 7,534 | 9,217 | 8,955 | 9,220 | 8,228 | 8,583 | 9,226 | 8,733 | 7,701 |
| 2006 | 7,743 | 4,363 | 8,199 | 6,460 | 5,349 | 3,365 | 1,798 | 2,434 | 1,090 | 1,036 | 694 | 1,053 |
| 2007 | 706 | 511 | 371 | 1,250 | 1,211 | 1,001 | 846 | 988 | 1,321 | 1,134 | 845 | 974 |
| 2008 | 804 | 64 | 532 | 705 | 970 | 1,331 | 1,649 | 1,141 | 879 | 947 | 603 | 586 |
| 2009 | 460 | 516 | 654 | 391 | 354 | 342 | 673 | 298 | -14 | 66 | -29 | -6 |
| 2010 | -79 | -45 | -6 | -5 | -3 | -9 | 0 | -4 | -39 | -20 | 5 | -9 |
| 2011 | -172 | -52 | 6 | -98 | 202 | 412 | 576 | 114 | -66 | 189 | 347 | -181 |
| 2012 | -139 | 24 | 71 | 142 | -133 | 23 | 7 | 125 | -40 | -14 | 45 | -14 |
| 2013 | 35 | 37 | 49 | 1 | -134 | 24 | 64 | 109 | 19 | 46 | -14 | -16 |
| 2014 | -15 | 8 | -7 | 4 | 207 | -56 | 10 | 72 | 15 | -18 | 17 | |
| 2015 | 43 | 49 | 208 | 148 | -126 | -10 | 24 | 30 | -41 | 1 | 13 | 13 |
| 2016 | 128 | 24 | -41 | 21 | 12 | 75 | 327 | 60 | 6 | 142 | ||
| 2017 | 129 | 139 | 91 | -14 | 6 | -8 | 44 | -32 | 7 | -22 | 5 | -5 |
| 2018 | 1,060 | 502 | 238 | 230 | -6 | 146 | 248 | 281 | 304 | 384 | 280 | 361 |
| 2019 | 290 | 258 | 37 | 160 | -80 | 49 | -43 | -5 | 1 | 5 | -4 | |
| 2020 | 0 | 52 | 4 | 113 | -119 | -3 | 1 | 8 | -3 | -5 | 35 | |
| 2021 | -18 | 11 | 5 | -24 | 3 | 40 | -25 | 27 | -26 | 38 | -51 | |
| 2022 | 4 | -20 | 50 | 12 | -16 | -42 | 5 | -12 | 34 | 2 | 40 | -63 |
| 2023 | 38 | -41 | 10 | 17 | -15 | -18 | 6 | -4 | -4 | 16 | 72 | 168 |
| 2024 | 125 | |||||||||||
| - = No Data Reported; -- = Not Applicable; NA = Not Available; W = Withheld to avoid disclosure of individual company data. |
| Release Date: 3/29/2024 |
| Next Release Date: 4/30/2024 |