|
Download Data (XLS File) |
|
||||||||
|
||||||||
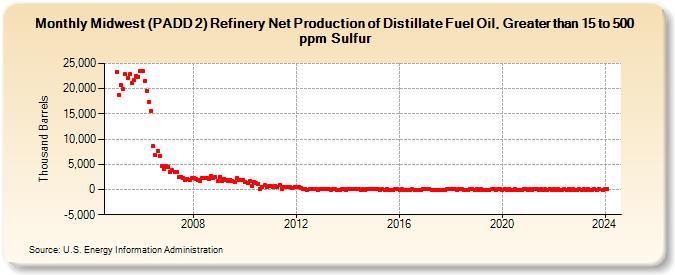
| Midwest (PADD 2) Refinery Net Production of Distillate Fuel Oil, Greater than 15 to 500 ppm Sulfur (Thousand Barrels) | ||||||||
| Year | Jan | Feb | Mar | Apr | May | Jun | Jul | Aug | Sep | Oct | Nov | Dec |
|---|---|---|---|---|---|---|---|---|---|---|---|---|
| 2005 | 23,234 | 18,772 | 20,649 | 19,913 | 22,833 | 22,068 | 22,849 | 21,151 | 21,677 | 22,530 | 22,379 | 23,572 |
| 2006 | 23,449 | 21,459 | 19,567 | 17,393 | 15,644 | 8,562 | 6,747 | 7,712 | 6,557 | 4,708 | 4,085 | 4,582 |
| 2007 | 4,533 | 3,514 | 3,786 | 3,564 | 3,478 | 2,507 | 2,415 | 2,319 | 1,848 | 2,133 | 1,876 | 2,189 |
| 2008 | 2,340 | 2,154 | 1,843 | 1,786 | 2,283 | 2,279 | 2,271 | 2,177 | 2,699 | 2,357 | 2,468 | 1,607 |
| 2009 | 2,493 | 1,662 | 2,032 | 1,901 | 1,677 | 1,964 | 1,738 | 1,450 | 2,260 | 1,863 | 1,820 | 1,872 |
| 2010 | 1,420 | 1,260 | 1,597 | 773 | 1,494 | 1,226 | 1,115 | 174 | 474 | 816 | 515 | 646 |
| 2011 | 680 | 502 | 625 | 519 | 915 | 184 | 418 | 410 | 446 | 429 | 354 | 593 |
| 2012 | 498 | 427 | 394 | 191 | 45 | -81 | 33 | 73 | 82 | 27 | -42 | 46 |
| 2013 | 19 | 57 | 121 | 46 | -48 | 23 | 24 | -29 | -36 | 124 | 127 | -33 |
| 2014 | 155 | 129 | 124 | 6 | 33 | 51 | -54 | 22 | 0 | 25 | 31 | 135 |
| 2015 | 24 | 93 | 29 | -10 | 47 | -53 | 129 | -138 | -78 | -156 | 35 | 58 |
| 2016 | -45 | 85 | -46 | -12 | -6 | -48 | 48 | -55 | -55 | -153 | -77 | 92 |
| 2017 | 65 | 35 | 50 | -70 | -71 | -172 | -182 | -152 | -96 | -39 | 46 | 144 |
| 2018 | 98 | 44 | 15 | -94 | 64 | 7 | -45 | -115 | -86 | 32 | 7 | -43 |
| 2019 | 38 | -45 | 122 | -14 | -13 | -131 | -3 | 35 | 31 | -148 | 32 | 19 |
| 2020 | -83 | 16 | -26 | 14 | -6 | -38 | 31 | -49 | -18 | -17 | 60 | 12 |
| 2021 | -73 | 7 | -11 | 21 | 13 | -3 | 44 | -103 | 7 | -68 | 66 | -43 |
| 2022 | 24 | -35 | 74 | -20 | -21 | 36 | -59 | 83 | -68 | 81 | -35 | -6 |
| 2023 | 29 | -64 | 86 | -95 | 113 | -105 | -37 | 115 | -72 | 78 | -97 | |
| 2024 | 22 | |||||||||||
| - = No Data Reported; -- = Not Applicable; NA = Not Available; W = Withheld to avoid disclosure of individual company data. |
| Release Date: 3/29/2024 |
| Next Release Date: 4/30/2024 |