|
Download Data (XLS File) |
|
||||||||
|
||||||||
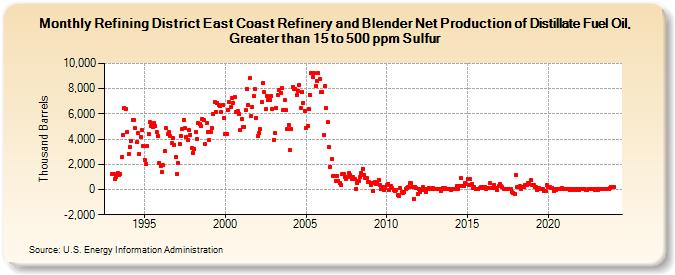
| Refining District East Coast Refinery and Blender Net Production of Distillate Fuel Oil, Greater than 15 to 500 ppm Sulfur (Thousand Barrels) | ||||||||
| Year | Jan | Feb | Mar | Apr | May | Jun | Jul | Aug | Sep | Oct | Nov | Dec |
|---|---|---|---|---|---|---|---|---|---|---|---|---|
| 1993 | 1,228 | 1,237 | 825 | 1,023 | 1,348 | 1,164 | 1,195 | 2,549 | 4,338 | 6,469 | 6,351 | 4,550 |
| 1994 | 2,801 | 3,410 | 3,851 | 5,522 | 5,546 | 4,841 | 3,737 | 4,483 | 2,832 | 4,168 | 4,747 | 3,450 |
| 1995 | 2,363 | 2,056 | 3,486 | 4,443 | 5,319 | 5,075 | 4,995 | 5,273 | 5,059 | 4,542 | 4,229 | 2,140 |
| 1996 | 1,836 | 1,403 | 1,906 | 3,027 | 4,845 | 4,384 | 4,535 | 4,230 | 3,665 | 4,061 | 3,567 | 2,577 |
| 1997 | 1,242 | 2,109 | 3,639 | 4,285 | 4,786 | 5,552 | 4,874 | 4,202 | 3,929 | 4,695 | 4,355 | 3,284 |
| 1998 | 2,921 | 3,207 | 4,532 | 4,036 | 5,279 | 5,198 | 5,070 | 5,613 | 5,483 | 3,587 | 5,256 | 4,545 |
| 1999 | 3,925 | 4,602 | 4,894 | 5,964 | 6,942 | 6,171 | 6,860 | 6,731 | 6,611 | 6,160 | 6,745 | 5,676 |
| 2000 | 4,417 | 4,411 | 6,331 | 6,913 | 6,539 | 7,229 | 6,869 | 7,331 | 6,183 | 6,222 | 5,996 | 4,686 |
| 2001 | 5,583 | 4,989 | 4,979 | 6,310 | 7,986 | 6,671 | 8,819 | 5,844 | 6,529 | 7,397 | 7,953 | 5,701 |
| 2002 | 4,210 | 4,497 | 4,772 | 6,933 | 8,468 | 7,699 | 6,355 | 7,402 | 7,071 | 7,109 | 7,392 | 6,371 |
| 2003 | 3,966 | 4,465 | 6,461 | 7,495 | 7,906 | 7,670 | 8,085 | 6,335 | 7,074 | 6,323 | 4,797 | 5,120 |
| 2004 | 3,133 | 4,792 | 8,160 | 8,010 | 7,973 | 7,483 | 7,831 | 8,291 | 6,447 | 7,762 | 6,885 | 6,245 |
| 2005 | 4,896 | 5,036 | 6,407 | 7,534 | 9,217 | 8,955 | 9,220 | 8,228 | 8,583 | 9,226 | 8,733 | 7,701 |
| 2006 | 7,743 | 4,363 | 8,199 | 6,460 | 5,349 | 3,365 | 1,798 | 2,434 | 1,090 | 1,036 | 694 | 1,053 |
| 2007 | 706 | 511 | 371 | 1,250 | 1,211 | 1,001 | 846 | 988 | 1,321 | 1,134 | 845 | 974 |
| 2008 | 804 | 64 | 532 | 705 | 970 | 1,331 | 1,649 | 1,141 | 879 | 947 | 603 | 586 |
| 2009 | 329 | 545 | -131 | 613 | 441 | 520 | 775 | 344 | 3 | 207 | -34 | 135 |
| 2010 | 347 | 458 | -5 | 294 | 82 | -49 | -123 | -1 | -410 | -479 | 115 | -206 |
| 2011 | -241 | -166 | 22 | 87 | 177 | 491 | 497 | 175 | -723 | 190 | 102 | -360 |
| 2012 | 18 | -204 | -22 | 171 | 75 | -161 | 41 | 130 | 12 | 13 | 84 | 30 |
| 2013 | 26 | 58 | 67 | 15 | -114 | 30 | 90 | 134 | 27 | 65 | 9 | 8 |
| 2014 | -15 | 23 | 52 | 32 | 261 | 64 | 270 | 938 | 312 | 296 | 538 | 430 |
| 2015 | 819 | 367 | 803 | 426 | 124 | 171 | 59 | 63 | 13 | 158 | 215 | 183 |
| 2016 | 129 | 161 | 72 | 100 | 97 | 487 | 84 | 111 | 386 | 124 | -69 | 289 |
| 2017 | 455 | 261 | 188 | 51 | 9 | 39 | 18 | 11 | 42 | -170 | -262 | -333 |
| 2018 | 1,150 | 219 | 174 | 256 | 37 | 220 | 223 | 321 | 359 | 513 | 445 | 736 |
| 2019 | 390 | 369 | 193 | 193 | 0 | 81 | 26 | 29 | 32 | -102 | -111 | 353 |
| 2020 | 201 | 187 | 146 | 141 | -111 | 25 | -15 | 29 | 14 | 58 | 155 | 61 |
| 2021 | 9 | 51 | 34 | -22 | 32 | 60 | -20 | 50 | -25 | 55 | -51 | |
| 2022 | 18 | 7 | 76 | 13 | -11 | -15 | 8 | 17 | 41 | 30 | 41 | -37 |
| 2023 | 73 | -16 | 10 | 32 | 14 | 16 | 17 | 17 | 15 | 67 | 106 | 168 |
| 2024 | 161 | |||||||||||
| - = No Data Reported; -- = Not Applicable; NA = Not Available; W = Withheld to avoid disclosure of individual company data. |
| Release Date: 3/29/2024 |
| Next Release Date: 4/30/2024 |