|
Download Data (XLS File) |
|
||||||||
|
||||||||
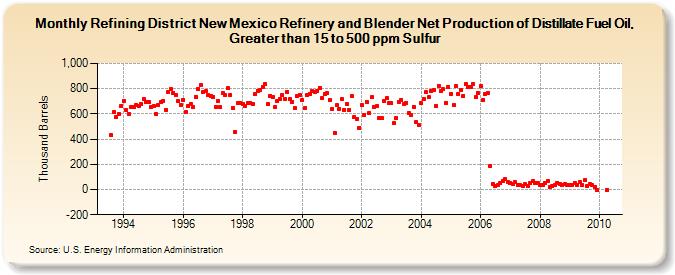
| Refining District New Mexico Refinery and Blender Net Production of Distillate Fuel Oil, Greater than 15 to 500 ppm Sulfur (Thousand Barrels) | ||||||||
| Year | Jan | Feb | Mar | Apr | May | Jun | Jul | Aug | Sep | Oct | Nov | Dec |
|---|---|---|---|---|---|---|---|---|---|---|---|---|
| 1993 | 432 | 614 | 578 | 600 | 666 | |||||||
| 1994 | 704 | 631 | 601 | 657 | 651 | 673 | 661 | 678 | 715 | 697 | 697 | 652 |
| 1995 | 662 | 601 | 673 | 693 | 705 | 633 | 773 | 797 | 769 | 750 | 702 | 673 |
| 1996 | 714 | 612 | 659 | 680 | 651 | 738 | 799 | 828 | 774 | 779 | 749 | 743 |
| 1997 | 737 | 657 | 704 | 653 | 764 | 746 | 802 | 753 | 649 | 458 | 686 | 690 |
| 1998 | 677 | 666 | 686 | 689 | 680 | 754 | 784 | 790 | 815 | 836 | 677 | 745 |
| 1999 | 731 | 655 | 704 | 715 | 749 | 722 | 775 | 716 | 697 | 644 | 743 | 749 |
| 2000 | 712 | 649 | 749 | 761 | 782 | 773 | 784 | 806 | 726 | 757 | 767 | 711 |
| 2001 | 642 | 452 | 667 | 642 | 717 | 634 | 679 | 629 | 742 | 576 | 560 | 491 |
| 2002 | 672 | 593 | 697 | 605 | 732 | 656 | 661 | 570 | 565 | 706 | 726 | 684 |
| 2003 | 683 | 527 | 567 | 696 | 708 | 679 | 688 | 609 | 588 | 657 | 536 | 514 |
| 2004 | 685 | 717 | 773 | 731 | 782 | 791 | 661 | 822 | 779 | 794 | 690 | 815 |
| 2005 | 761 | 672 | 821 | 759 | 792 | 744 | 835 | 814 | 811 | 836 | 732 | 764 |
| 2006 | 820 | 713 | 754 | 769 | 186 | 45 | 31 | 39 | 49 | 70 | 80 | 57 |
| 2007 | 55 | 43 | 57 | 37 | 33 | 29 | 40 | 31 | 52 | 64 | 49 | 48 |
| 2008 | 32 | 39 | 52 | 66 | 22 | 26 | 35 | 54 | 44 | 37 | 43 | 32 |
| 2009 | 38 | 32 | 55 | 35 | 60 | 37 | 73 | 28 | 43 | 34 | 21 | -1 |
| 2010 | -1 | |||||||||||
| - = No Data Reported; -- = Not Applicable; NA = Not Available; W = Withheld to avoid disclosure of individual company data. |
| Release Date: 3/29/2024 |
| Next Release Date: 4/30/2024 |