|
Download Data (XLS File) |
|
||||||||
|
||||||||
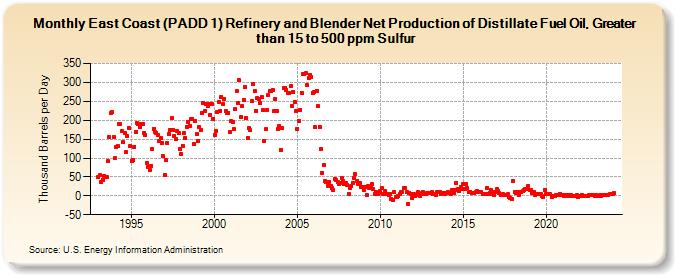
| East Coast (PADD 1) Refinery and Blender Net Production of Distillate Fuel Oil, Greater than 15 to 500 ppm Sulfur (Thousand Barrels per Day) | ||||||||
| Year | Jan | Feb | Mar | Apr | May | Jun | Jul | Aug | Sep | Oct | Nov | Dec |
|---|---|---|---|---|---|---|---|---|---|---|---|---|
| 1993 | 49 | 54 | 36 | 43 | 52 | 50 | 49 | 92 | 155 | 218 | 221 | 156 |
| 1994 | 99 | 130 | 133 | 191 | 189 | 172 | 142 | 167 | 116 | 157 | 180 | 131 |
| 1995 | 93 | 94 | 130 | 170 | 192 | 191 | 181 | 191 | 190 | 167 | 161 | 87 |
| 1996 | 77 | 67 | 80 | 124 | 178 | 168 | 167 | 160 | 145 | 154 | 139 | 104 |
| 1997 | 55 | 94 | 139 | 163 | 175 | 205 | 175 | 158 | 149 | 171 | 165 | 125 |
| 1998 | 111 | 133 | 165 | 153 | 183 | 196 | 185 | 202 | 204 | 137 | 197 | 164 |
| 1999 | 146 | 182 | 175 | 220 | 246 | 224 | 242 | 238 | 242 | 215 | 242 | 204 |
| 2000 | 160 | 171 | 222 | 249 | 225 | 262 | 242 | 256 | 224 | 220 | 220 | 168 |
| 2001 | 197 | 195 | 176 | 229 | 276 | 245 | 305 | 208 | 237 | 253 | 287 | 205 |
| 2002 | 153 | 179 | 173 | 250 | 295 | 278 | 225 | 259 | 255 | 245 | 261 | 226 |
| 2003 | 146 | 176 | 227 | 267 | 276 | 276 | 281 | 224 | 256 | 223 | 178 | 185 |
| 2004 | 122 | 179 | 285 | 286 | 281 | 272 | 271 | 290 | 238 | 274 | 248 | 224 |
| 2005 | 178 | 199 | 227 | 273 | 323 | 321 | 324 | 292 | 311 | 320 | 314 | 272 |
| 2006 | 275 | 181 | 278 | 237 | 183 | 123 | 61 | 82 | 39 | 37 | 26 | 37 |
| 2007 | 26 | 21 | 15 | 45 | 42 | 36 | 30 | 35 | 47 | 38 | 31 | 35 |
| 2008 | 29 | 5 | 20 | 26 | 34 | 47 | 57 | 40 | 32 | 33 | 23 | 22 |
| 2009 | 15 | 24 | 2 | 26 | 20 | 22 | 30 | 17 | 6 | 10 | 4 | 8 |
| 2010 | 14 | 21 | 5 | 14 | 5 | 5 | 1 | 6 | -8 | -10 | 9 | -2 |
| 2011 | -2 | -1 | 5 | 9 | 10 | 21 | 20 | 9 | -22 | 8 | 6 | -6 |
| 2012 | 4 | 0 | 2 | 9 | 7 | 0 | 6 | 10 | 6 | 6 | 8 | 7 |
| 2013 | 8 | 9 | 6 | 4 | 2 | 9 | 9 | 11 | 6 | 8 | 7 | 6 |
| 2014 | 7 | 9 | 8 | 6 | 16 | 8 | 16 | 35 | 17 | 14 | 23 | 18 |
| 2015 | 30 | 19 | 31 | 20 | 9 | 11 | 7 | 8 | 7 | 10 | 12 | 9 |
| 2016 | 9 | 9 | 5 | 5 | 6 | 20 | 6 | 7 | 16 | 6 | 1 | 11 |
| 2017 | 17 | 12 | 8 | 3 | 3 | 4 | 2 | 3 | 4 | -4 | -6 | -8 |
| 2018 | 40 | 10 | 8 | 11 | 3 | 10 | 10 | 12 | 15 | 19 | 17 | 26 |
| 2019 | 15 | 16 | 8 | 9 | 2 | 6 | 4 | 4 | 4 | 0 | -2 | 15 |
| 2020 | 5 | 6 | 5 | 4 | -3 | 0 | -1 | 1 | 1 | 2 | 5 | 2 |
| 2021 | 1 | 0 | 2 | 1 | 0 | 1 | 2 | 0 | 0 | 0 | 1 | -2 |
| 2022 | 0 | 0 | 2 | 0 | -1 | -1 | 0 | 1 | 1 | 1 | 1 | -1 |
| 2023 | 2 | -1 | 0 | 1 | 0 | 1 | 1 | 1 | 1 | 2 | 4 | 5 |
| 2024 | 5 | |||||||||||
| - = No Data Reported; -- = Not Applicable; NA = Not Available; W = Withheld to avoid disclosure of individual company data. |
| Release Date: 3/29/2024 |
| Next Release Date: 4/30/2024 |