|
Download Data (XLS File) |
|
||||||||
|
||||||||
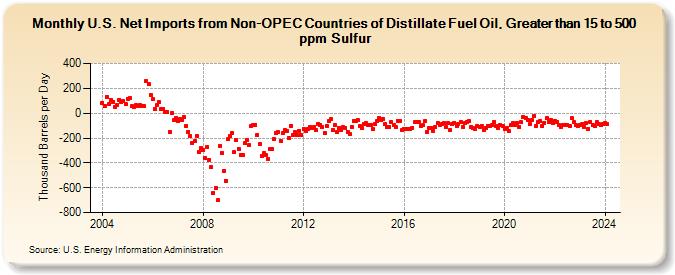
| U.S. Net Imports from Non-OPEC Countries of Distillate Fuel Oil, Greater than 15 to 500 ppm Sulfur (Thousand Barrels per Day) | ||||||||
| Year | Jan | Feb | Mar | Apr | May | Jun | Jul | Aug | Sep | Oct | Nov | Dec |
|---|---|---|---|---|---|---|---|---|---|---|---|---|
| 2004 | 85 | 55 | 131 | 70 | 109 | 93 | 48 | 62 | 110 | 89 | 97 | 71 |
| 2005 | 118 | 119 | 56 | 46 | 62 | 56 | 64 | 58 | 56 | 257 | 232 | 147 |
| 2006 | 111 | 35 | 63 | 88 | 33 | 35 | 8 | 9 | -149 | 1 | -57 | -35 |
| 2007 | -65 | -46 | -57 | -31 | -101 | -149 | -182 | -237 | -222 | -181 | -314 | -284 |
| 2008 | -295 | -357 | -273 | -373 | -433 | -643 | -600 | -702 | -266 | -318 | -463 | -543 |
| 2009 | -209 | -186 | -159 | -316 | -218 | -286 | -334 | -340 | -243 | -216 | -257 | -102 |
| 2010 | -95 | -92 | -174 | -251 | -341 | -319 | -336 | -369 | -291 | -290 | -210 | -163 |
| 2011 | -152 | -223 | -160 | -139 | -141 | -201 | -101 | -176 | -151 | -176 | -141 | -172 |
| 2012 | -125 | -141 | -127 | -114 | -116 | -111 | -139 | -85 | -95 | -110 | -158 | -100 |
| 2013 | -63 | -50 | -136 | -99 | -150 | -120 | -139 | -112 | -119 | -149 | -169 | -109 |
| 2014 | -59 | -60 | -58 | -104 | -122 | -85 | -83 | -95 | -92 | -124 | -87 | -66 |
| 2015 | -37 | -53 | -44 | -88 | -111 | -110 | -73 | -93 | -115 | -59 | -61 | -134 |
| 2016 | -125 | -125 | -131 | -124 | -116 | -74 | -72 | -73 | -104 | -99 | -67 | -149 |
| 2017 | -122 | -118 | -140 | -113 | -80 | -97 | -89 | -82 | -111 | -83 | -135 | -88 |
| 2018 | -77 | -100 | -85 | -69 | -114 | -78 | -69 | -67 | -112 | -118 | -127 | -102 |
| 2019 | -115 | -104 | -135 | -120 | -102 | -104 | -98 | -69 | -101 | -120 | -97 | -107 |
| 2020 | -125 | -119 | -146 | -98 | -82 | -96 | -81 | -113 | -75 | -28 | -38 | -53 |
| 2021 | -90 | -56 | -23 | -101 | -72 | -65 | -107 | -76 | -42 | -68 | -56 | -78 |
| 2022 | -59 | -69 | -97 | -115 | -96 | -93 | -97 | -101 | -41 | -75 | -99 | -107 |
| 2023 | -96 | -87 | -108 | -81 | -127 | -70 | -99 | -101 | -74 | -89 | -98 | -88 |
| 2024 | -76 | |||||||||||
| - = No Data Reported; -- = Not Applicable; NA = Not Available; W = Withheld to avoid disclosure of individual company data. |
| Release Date: 3/29/2024 |
| Next Release Date: 4/30/2024 |