|
Download Data (XLS File) |
|
||||||||
|
||||||||
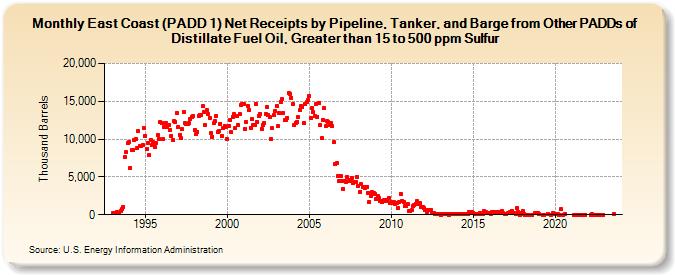
| East Coast (PADD 1) Net Receipts by Pipeline, Tanker, and Barge from Other PADDs of Distillate Fuel Oil, Greater than 15 to 500 ppm Sulfur (Thousand Barrels) | ||||||||
| Year | Jan | Feb | Mar | Apr | May | Jun | Jul | Aug | Sep | Oct | Nov | Dec |
|---|---|---|---|---|---|---|---|---|---|---|---|---|
| 1993 | 183 | 180 | 200 | 307 | 238 | 190 | 546 | 702 | 1,072 | 7,642 | 8,258 | 9,450 |
| 1994 | 9,670 | 6,235 | 8,564 | 8,511 | 9,836 | 10,009 | 8,807 | 11,030 | 9,093 | 9,079 | 9,271 | 11,428 |
| 1995 | 10,475 | 8,671 | 9,521 | 7,908 | 9,944 | 9,198 | 9,637 | 8,893 | 9,502 | 10,529 | 10,048 | 12,234 |
| 1996 | 12,087 | 9,960 | 11,621 | 12,101 | 11,651 | 11,809 | 11,261 | 10,424 | 9,862 | 12,346 | 12,285 | 13,505 |
| 1997 | 11,625 | 10,577 | 10,141 | 11,288 | 13,567 | 12,077 | 11,955 | 11,934 | 12,064 | 12,693 | 12,988 | 13,101 |
| 1998 | 11,201 | 10,653 | 10,940 | 13,058 | 13,176 | 13,139 | 14,362 | 13,599 | 11,813 | 13,793 | 13,371 | 12,851 |
| 1999 | 10,761 | 10,333 | 12,067 | 12,389 | 13,055 | 10,988 | 11,081 | 12,033 | 10,454 | 11,435 | 11,792 | 11,630 |
| 2000 | 9,996 | 11,728 | 12,540 | 10,879 | 12,988 | 13,287 | 11,416 | 13,085 | 11,853 | 13,341 | 14,499 | 14,628 |
| 2001 | 14,643 | 11,395 | 12,287 | 14,427 | 13,902 | 11,492 | 12,621 | 11,819 | 11,841 | 14,700 | 12,284 | 13,060 |
| 2002 | 13,294 | 11,342 | 11,886 | 12,144 | 13,311 | 14,245 | 13,219 | 12,877 | 10,003 | 11,434 | 13,158 | 13,709 |
| 2003 | 14,395 | 11,684 | 13,454 | 14,941 | 15,252 | 13,434 | 12,509 | 12,476 | 12,816 | 16,043 | 15,975 | 15,474 |
| 2004 | 14,624 | 11,840 | 12,116 | 12,319 | 12,872 | 13,799 | 14,352 | 14,277 | 12,084 | 14,616 | 14,885 | 15,192 |
| 2005 | 15,663 | 12,769 | 14,093 | 13,520 | 13,015 | 14,641 | 12,975 | 14,737 | 11,896 | 10,092 | 12,575 | 14,077 |
| 2006 | 11,669 | 12,395 | 12,264 | 11,813 | 12,151 | 11,729 | 9,555 | 6,661 | 6,780 | 5,137 | 4,473 | 5,087 |
| 2007 | 4,417 | 3,446 | 4,489 | 4,376 | 4,925 | 4,397 | 4,529 | 4,896 | 4,141 | 4,317 | 4,368 | 5,026 |
| 2008 | 3,807 | 3,060 | 3,996 | 3,684 | 3,725 | 3,540 | 3,711 | 2,920 | 1,694 | 2,444 | 2,965 | 2,869 |
| 2009 | 2,760 | 2,048 | 2,517 | 2,180 | 1,814 | 1,729 | 1,829 | 1,983 | 1,790 | 1,903 | 2,191 | 1,575 |
| 2010 | 1,666 | 1,494 | 1,627 | 1,402 | 1,579 | 856 | 1,703 | 2,772 | 1,840 | 1,720 | 1,101 | 1,118 |
| 2011 | 1,426 | 454 | 428 | 619 | 1,203 | 1,333 | 1,420 | 1,762 | 1,481 | 1,502 | 1,082 | 1,012 |
| 2012 | 856 | 569 | 395 | 620 | 636 | 671 | 216 | 221 | 89 | 109 | 149 | 85 |
| 2013 | 25 | 29 | 77 | 96 | 75 | 69 | 14 | 42 | 95 | 39 | 71 | 80 |
| 2014 | 58 | 64 | 71 | 58 | 92 | 58 | 118 | 46 | 42 | 372 | 295 | 312 |
| 2015 | 236 | 125 | 48 | 50 | 95 | 241 | 158 | 148 | 433 | 358 | 196 | 267 |
| 2016 | 174 | 107 | 302 | 181 | 323 | 239 | 337 | 424 | 392 | 458 | 191 | 94 |
| 2017 | 90 | 164 | 207 | 386 | 477 | 199 | 253 | 105 | 828 | 331 | 26 | 237 |
| 2018 | 473 | 143 | 26 | 16 | 1 | 175 | 265 | 236 | ||||
| 2019 | 86 | 1 | 1 | 56 | 4 | 187 | 39 | |||||
| 2020 | 65 | 63 | 42 | 21 | 695 | 22 | 144 | |||||
| 2021 | 1 | 1 | 1 | 1 | 1 | 1 | 1 | 1 | 1 | |||
| 2022 | 1 | 65 | 1 | 1 | 1 | 1 | 1 | 1 | 1 | |||
| 2023 | 99 | |||||||||||
| - = No Data Reported; -- = Not Applicable; NA = Not Available; W = Withheld to avoid disclosure of individual company data. |
| Release Date: 3/29/2024 |
| Next Release Date: 4/30/2024 |
Referring Pages: