|
Download Data (XLS File) |
|
||||||||
|
||||||||
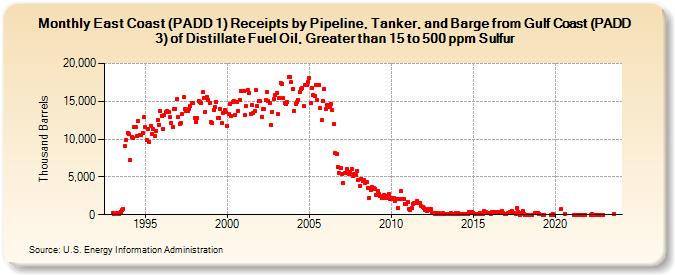
| East Coast (PADD 1) Receipts by Pipeline, Tanker, and Barge from Gulf Coast (PADD 3) of Distillate Fuel Oil, Greater than 15 to 500 ppm Sulfur (Thousand Barrels) | ||||||||
| Year | Jan | Feb | Mar | Apr | May | Jun | Jul | Aug | Sep | Oct | Nov | Dec |
|---|---|---|---|---|---|---|---|---|---|---|---|---|
| 1993 | 161 | 127 | 137 | 252 | 208 | 147 | 398 | 619 | 813 | 9,152 | 9,871 | 10,837 |
| 1994 | 10,609 | 7,190 | 10,238 | 10,081 | 11,622 | 11,617 | 10,387 | 12,451 | 10,551 | 10,607 | 10,760 | 12,875 |
| 1995 | 11,560 | 9,894 | 11,352 | 9,575 | 11,762 | 10,680 | 11,278 | 10,414 | 11,126 | 12,526 | 11,916 | 13,739 |
| 1996 | 13,115 | 11,343 | 13,187 | 13,598 | 13,743 | 13,633 | 12,877 | 12,178 | 11,605 | 13,953 | 14,018 | 15,268 |
| 1997 | 12,903 | 12,057 | 12,135 | 13,362 | 15,529 | 13,944 | 13,692 | 13,734 | 13,999 | 14,419 | 14,725 | 14,758 |
| 1998 | 12,741 | 12,252 | 12,736 | 15,023 | 14,866 | 14,715 | 16,164 | 15,480 | 13,597 | 15,630 | 15,188 | 14,822 |
| 1999 | 12,205 | 12,086 | 13,840 | 14,301 | 14,942 | 12,811 | 12,827 | 13,999 | 12,110 | 13,503 | 13,868 | 13,533 |
| 2000 | 11,781 | 13,344 | 14,583 | 13,043 | 14,952 | 15,077 | 13,223 | 14,876 | 13,728 | 15,190 | 16,397 | 16,397 |
| 2001 | 16,376 | 13,152 | 14,322 | 16,450 | 16,095 | 13,362 | 14,492 | 13,470 | 13,726 | 16,432 | 14,350 | 14,992 |
| 2002 | 15,026 | 12,981 | 13,966 | 13,960 | 15,105 | 16,244 | 15,096 | 14,763 | 11,802 | 13,561 | 15,265 | 15,873 |
| 2003 | 16,083 | 13,308 | 15,490 | 17,429 | 17,275 | 15,399 | 14,801 | 14,595 | 14,840 | 18,150 | 18,274 | 17,499 |
| 2004 | 16,662 | 13,780 | 14,662 | 14,854 | 15,222 | 16,250 | 16,612 | 16,703 | 14,391 | 17,177 | 17,122 | 17,552 |
| 2005 | 18,019 | 14,837 | 16,782 | 15,775 | 15,647 | 17,144 | 15,192 | 17,104 | 14,067 | 12,515 | 15,063 | 16,636 |
| 2006 | 13,938 | 14,518 | 14,555 | 14,184 | 14,585 | 13,844 | 11,968 | 8,175 | 8,059 | 6,329 | 5,533 | 6,193 |
| 2007 | 5,395 | 4,162 | 5,498 | 5,496 | 5,995 | 5,393 | 5,618 | 6,039 | 5,085 | 5,372 | 5,305 | 5,833 |
| 2008 | 4,576 | 3,835 | 4,779 | 4,400 | 4,545 | 4,236 | 4,333 | 3,575 | 2,262 | 3,203 | 3,606 | 3,554 |
| 2009 | 3,345 | 2,612 | 3,189 | 2,736 | 2,421 | 2,187 | 2,291 | 2,631 | 2,263 | 2,459 | 2,733 | 2,039 |
| 2010 | 2,181 | 2,063 | 2,220 | 1,863 | 2,083 | 950 | 2,066 | 3,094 | 2,126 | 2,047 | 1,373 | 1,401 |
| 2011 | 1,689 | 693 | 670 | 853 | 1,464 | 1,548 | 1,516 | 1,852 | 1,563 | 1,518 | 1,134 | 1,085 |
| 2012 | 894 | 681 | 457 | 691 | 646 | 746 | 257 | 257 | 80 | 207 | 146 | 206 |
| 2013 | 47 | 34 | 185 | 159 | 125 | 157 | 107 | 128 | 180 | 90 | 137 | 173 |
| 2014 | 127 | 173 | 158 | 115 | 124 | 58 | 118 | 46 | 42 | 372 | 295 | 312 |
| 2015 | 236 | 125 | 48 | 50 | 95 | 241 | 158 | 148 | 433 | 358 | 196 | 267 |
| 2016 | 174 | 107 | 302 | 181 | 323 | 239 | 337 | 424 | 392 | 458 | 191 | 94 |
| 2017 | 90 | 164 | 207 | 386 | 477 | 199 | 253 | 105 | 828 | 331 | 26 | 237 |
| 2018 | 473 | 143 | 26 | 16 | 1 | 175 | 265 | 236 | ||||
| 2019 | 86 | 1 | 1 | 4 | 144 | 3 | ||||||
| 2020 | 695 | 144 | ||||||||||
| 2021 | 1 | 1 | 1 | 1 | 1 | 1 | 1 | 1 | 1 | |||
| 2022 | 1 | 65 | 1 | 1 | 1 | 1 | 1 | 1 | 1 | |||
| 2023 | 99 | |||||||||||
| - = No Data Reported; -- = Not Applicable; NA = Not Available; W = Withheld to avoid disclosure of individual company data. |
| Release Date: 3/29/2024 |
| Next Release Date: 4/30/2024 |