|
Download Data (XLS File) |
|
||||||||
|
||||||||
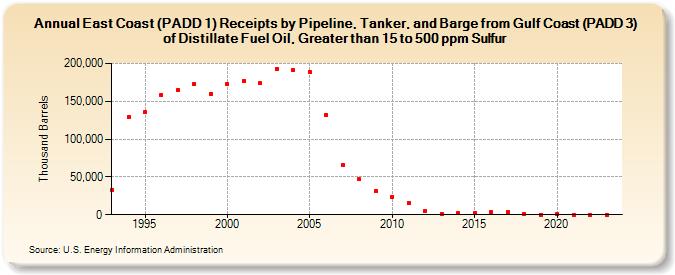
| East Coast (PADD 1) Receipts by Pipeline, Tanker, and Barge from Gulf Coast (PADD 3) of Distillate Fuel Oil, Greater than 15 to 500 ppm Sulfur (Thousand Barrels) | ||||||||
| Decade | Year-0 | Year-1 | Year-2 | Year-3 | Year-4 | Year-5 | Year-6 | Year-7 | Year-8 | Year-9 |
|---|---|---|---|---|---|---|---|---|---|---|
| 1990's | 32,722 | 128,988 | 135,822 | 158,518 | 165,257 | 173,214 | 160,025 | |||
| 2000's | 172,591 | 177,219 | 173,642 | 193,143 | 190,987 | 188,781 | 131,881 | 65,191 | 46,904 | 30,906 |
| 2010's | 23,467 | 15,585 | 5,268 | 1,522 | 1,940 | 2,355 | 3,222 | 3,303 | 1,335 | 239 |
| 2020's | 839 | 9 | 73 | 99 |
| - = No Data Reported; -- = Not Applicable; NA = Not Available; W = Withheld to avoid disclosure of individual company data. |
| Release Date: 8/30/2024 |
| Next Release Date: 8/29/2025 |