|
Download Data (XLS File) |
|
||||||||
|
||||||||
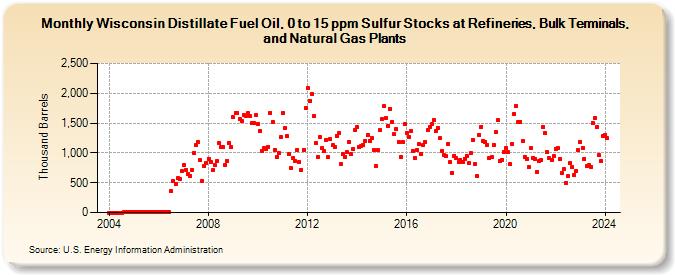
| Wisconsin Distillate Fuel Oil, 0 to 15 ppm Sulfur Stocks at Refineries, Bulk Terminals, and Natural Gas Plants (Thousand Barrels) | ||||||||
| Year | Jan | Feb | Mar | Apr | May | Jun | Jul | Aug | Sep | Oct | Nov | Dec |
|---|---|---|---|---|---|---|---|---|---|---|---|---|
| 2004 | 1 | 1 | 1 | 1 | 1 | 1 | 5 | 5 | 5 | 3 | 2 | |
| 2005 | 4 | 4 | 2 | 2 | 2 | 5 | 8 | 8 | 8 | 4 | 2 | 3 |
| 2006 | 7 | 6 | 7 | 4 | 5 | 5 | 355 | 522 | 473 | 575 | 563 | 689 |
| 2007 | 794 | 722 | 650 | 619 | 717 | 1,006 | 1,139 | 1,184 | 881 | 526 | 780 | 836 |
| 2008 | 905 | 853 | 707 | 801 | 857 | 1,159 | 1,100 | 1,093 | 795 | 867 | 1,173 | 1,092 |
| 2009 | 1,596 | 1,677 | 1,672 | 1,568 | 1,534 | 1,631 | 1,624 | 1,671 | 1,615 | 1,497 | 1,497 | 1,629 |
| 2010 | 1,493 | 1,371 | 1,032 | 1,091 | 1,072 | 1,106 | 1,675 | 1,521 | 1,056 | 933 | 993 | 1,259 |
| 2011 | 1,670 | 1,420 | 1,283 | 977 | 742 | 914 | 871 | 1,056 | 844 | 722 | 1,054 | 1,748 |
| 2012 | 2,086 | 1,879 | 1,991 | 1,619 | 1,160 | 938 | 1,261 | 1,080 | 1,027 | 1,218 | 933 | 1,227 |
| 2013 | 1,127 | 1,096 | 1,290 | 1,333 | 810 | 974 | 937 | 1,012 | 1,182 | 978 | 1,068 | 1,386 |
| 2014 | 1,428 | 1,093 | 1,120 | 1,133 | 1,199 | 1,299 | 1,205 | 1,248 | 1,054 | 780 | 1,047 | 1,377 |
| 2015 | 1,563 | 1,788 | 1,592 | 1,458 | 1,743 | 1,519 | 1,311 | 1,397 | 1,180 | 938 | 1,178 | 1,478 |
| 2016 | 1,337 | 1,274 | 1,371 | 1,030 | 917 | 1,055 | 1,157 | 989 | 1,139 | 1,182 | 1,384 | 1,440 |
| 2017 | 1,477 | 1,559 | 1,367 | 1,425 | 1,244 | 1,034 | 964 | 945 | 1,154 | 851 | 668 | 953 |
| 2018 | 914 | 845 | 880 | 841 | 906 | 952 | 828 | 994 | 1,221 | 818 | 614 | 1,306 |
| 2019 | 1,442 | 1,193 | 1,186 | 1,136 | 908 | 925 | 1,134 | 1,350 | 1,549 | 861 | 886 | 1,019 |
| 2020 | 1,083 | 1,011 | 810 | 1,155 | 1,657 | 1,787 | 1,527 | 1,520 | 1,202 | 936 | 902 | 756 |
| 2021 | 1,075 | 920 | 903 | 687 | 864 | 876 | 1,431 | 1,332 | 1,009 | 911 | 875 | 946 |
| 2022 | 1,074 | 1,080 | 894 | 664 | 726 | 496 | 611 | 825 | 760 | 631 | 694 | 1,048 |
| 2023 | 1,187 | 1,087 | 902 | 773 | 797 | 766 | 1,509 | 1,590 | 1,433 | 965 | 861 | 1,283 |
| 2024 | 1,304 | |||||||||||
| - = No Data Reported; -- = Not Applicable; NA = Not Available; W = Withheld to avoid disclosure of individual company data. |
| Release Date: 3/29/2024 |
| Next Release Date: 4/30/2024 |