|
Download Data (XLS File) |
|
||||||||
|
||||||||
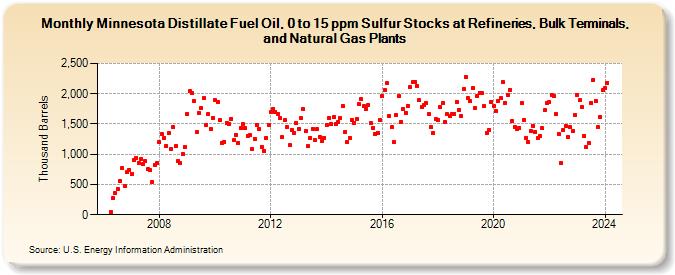
| Minnesota Distillate Fuel Oil, 0 to 15 ppm Sulfur Stocks at Refineries, Bulk Terminals, and Natural Gas Plants (Thousand Barrels) | ||||||||
| Year | Jan | Feb | Mar | Apr | May | Jun | Jul | Aug | Sep | Oct | Nov | Dec |
|---|---|---|---|---|---|---|---|---|---|---|---|---|
| 2006 | 42 | 271 | 353 | 423 | 551 | 773 | 469 | 698 | 746 | |||
| 2007 | 679 | 904 | 944 | 855 | 915 | 842 | 884 | 751 | 732 | 541 | 828 | 852 |
| 2008 | 1,196 | 1,338 | 1,275 | 1,137 | 1,345 | 1,085 | 1,442 | 1,136 | 890 | 852 | 1,000 | 1,124 |
| 2009 | 1,667 | 2,037 | 2,018 | 1,879 | 1,363 | 1,685 | 1,765 | 1,922 | 1,479 | 1,657 | 1,413 | 1,605 |
| 2010 | 1,890 | 1,868 | 1,563 | 1,187 | 1,207 | 1,512 | 1,505 | 1,586 | 1,230 | 1,323 | 1,184 | 1,434 |
| 2011 | 1,497 | 1,426 | 1,307 | 1,312 | 1,083 | 1,258 | 1,489 | 1,417 | 1,122 | 1,055 | 1,271 | 1,486 |
| 2012 | 1,690 | 1,749 | 1,690 | 1,665 | 1,598 | 1,277 | 1,562 | 1,452 | 1,147 | 1,403 | 1,355 | 1,508 |
| 2013 | 1,420 | 1,591 | 1,740 | 1,379 | 1,129 | 1,276 | 1,419 | 1,231 | 1,413 | 1,285 | 1,217 | 1,275 |
| 2014 | 1,488 | 1,599 | 1,505 | 1,611 | 1,497 | 1,532 | 1,593 | 1,796 | 1,370 | 1,197 | 1,273 | 1,569 |
| 2015 | 1,523 | 1,580 | 1,826 | 1,912 | 1,789 | 1,752 | 1,816 | 1,519 | 1,441 | 1,329 | 1,357 | 1,568 |
| 2016 | 1,959 | 2,058 | 2,171 | 1,631 | 1,444 | 1,200 | 1,652 | 1,957 | 1,533 | 1,748 | 1,689 | 1,805 |
| 2017 | 2,117 | 2,187 | 2,200 | 2,128 | 1,890 | 1,783 | 1,812 | 1,846 | 1,658 | 1,443 | 1,356 | 1,575 |
| 2018 | 1,562 | 1,774 | 1,844 | 1,536 | 1,660 | 1,628 | 1,665 | 1,670 | 1,868 | 1,733 | 1,633 | 2,081 |
| 2019 | 2,273 | 1,928 | 1,875 | 2,096 | 1,763 | 1,959 | 2,014 | 2,005 | 1,792 | 1,354 | 1,408 | 1,869 |
| 2020 | 1,794 | 1,708 | 1,885 | 1,924 | 2,193 | 1,844 | 1,986 | 2,068 | 1,548 | 1,458 | 1,410 | 1,437 |
| 2021 | 1,843 | 1,569 | 1,273 | 1,197 | 1,383 | 1,471 | 1,371 | 1,264 | 1,301 | 1,426 | 1,725 | 1,852 |
| 2022 | 1,857 | 1,974 | 1,960 | 1,660 | 1,337 | 849 | 1,407 | 1,468 | 1,281 | 1,444 | 1,377 | 1,649 |
| 2023 | 1,972 | 1,889 | 1,784 | 1,307 | 1,116 | 1,186 | 1,853 | 2,233 | 1,881 | 1,410 | 1,623 | 2,060 |
| 2024 | 2,092 | 2,182 | 2,063 | 1,509 | 1,889 | 1,790 | ||||||
| - = No Data Reported; -- = Not Applicable; NA = Not Available; W = Withheld to avoid disclosure of individual company data. |
| Release Date: 8/30/2024 |
| Next Release Date: 9/30/2024 |