|
Download Data (XLS File) |
|
||||||||
|
||||||||
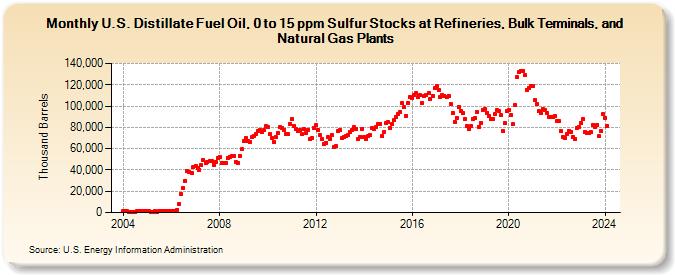
| U.S. Distillate Fuel Oil, 0 to 15 ppm Sulfur Stocks at Refineries, Bulk Terminals, and Natural Gas Plants (Thousand Barrels) | ||||||||
| Year | Jan | Feb | Mar | Apr | May | Jun | Jul | Aug | Sep | Oct | Nov | Dec |
|---|---|---|---|---|---|---|---|---|---|---|---|---|
| 2004 | 1,114 | 1,129 | 1,000 | 808 | 944 | 858 | 947 | 1,050 | 1,074 | 1,107 | 1,450 | 1,182 |
| 2005 | 1,143 | 1,018 | 906 | 911 | 1,110 | 971 | 1,160 | 1,283 | 1,353 | 1,402 | 1,110 | 1,678 |
| 2006 | 1,921 | 1,636 | 1,664 | 2,706 | 8,486 | 17,062 | 22,975 | 29,776 | 39,468 | 38,422 | 37,260 | 42,923 |
| 2007 | 43,793 | 41,520 | 40,413 | 44,385 | 49,260 | 46,457 | 47,102 | 48,558 | 48,197 | 45,071 | 47,541 | 51,005 |
| 2008 | 51,803 | 46,339 | 46,933 | 46,730 | 51,035 | 52,415 | 52,938 | 53,267 | 47,759 | 46,709 | 53,277 | 59,307 |
| 2009 | 67,157 | 70,227 | 67,397 | 65,945 | 70,677 | 72,058 | 73,808 | 76,783 | 77,932 | 75,204 | 77,280 | 80,920 |
| 2010 | 79,889 | 73,661 | 70,030 | 66,688 | 70,940 | 74,514 | 79,980 | 79,679 | 77,801 | 74,143 | 73,930 | 83,416 |
| 2011 | 87,990 | 81,648 | 78,468 | 76,224 | 77,750 | 73,516 | 78,326 | 74,611 | 77,780 | 68,725 | 70,106 | 79,587 |
| 2012 | 82,033 | 77,812 | 73,009 | 69,277 | 64,587 | 65,750 | 70,550 | 69,386 | 72,822 | 61,792 | 62,219 | 76,770 |
| 2013 | 77,714 | 69,653 | 71,341 | 71,504 | 73,091 | 75,816 | 77,581 | 79,888 | 78,822 | 68,906 | 71,428 | 78,853 |
| 2014 | 71,035 | 69,089 | 71,968 | 72,816 | 79,063 | 78,890 | 80,399 | 83,093 | 83,469 | 71,516 | 75,974 | 83,738 |
| 2015 | 84,902 | 79,273 | 83,311 | 87,087 | 90,110 | 92,476 | 94,493 | 102,513 | 98,920 | 91,013 | 102,685 | 108,677 |
| 2016 | 107,922 | 110,554 | 112,007 | 108,905 | 109,995 | 102,660 | 109,797 | 110,832 | 111,907 | 106,297 | 109,725 | 116,834 |
| 2017 | 118,926 | 115,546 | 108,098 | 110,319 | 109,742 | 108,273 | 109,506 | 101,966 | 93,712 | 85,487 | 89,000 | 99,349 |
| 2018 | 95,495 | 93,162 | 87,438 | 81,503 | 78,106 | 80,844 | 87,880 | 88,745 | 94,893 | 80,715 | 84,409 | 96,527 |
| 2019 | 97,515 | 93,841 | 91,035 | 87,594 | 88,269 | 92,340 | 96,153 | 95,631 | 91,185 | 76,998 | 83,899 | 95,271 |
| 2020 | 96,159 | 91,180 | 82,855 | 100,633 | 126,888 | 131,706 | 133,395 | 133,230 | 128,775 | 115,550 | 117,311 | 119,219 |
| 2021 | 119,031 | 105,265 | 102,311 | 94,991 | 93,956 | 96,969 | 95,915 | 93,853 | 89,789 | 89,884 | 89,482 | 90,888 |
| 2022 | 86,004 | 85,532 | 76,590 | 70,818 | 70,360 | 73,423 | 76,745 | 75,837 | 71,287 | 69,281 | 79,825 | 80,190 |
| 2023 | 84,333 | 87,656 | 76,103 | 74,867 | 74,422 | 75,339 | 82,660 | 80,663 | 82,650 | 71,638 | 76,692 | 92,472 |
| 2024 | 89,261 | |||||||||||
| - = No Data Reported; -- = Not Applicable; NA = Not Available; W = Withheld to avoid disclosure of individual company data. |
| Release Date: 3/29/2024 |
| Next Release Date: 4/30/2024 |