|
Download Data (XLS File) |
|
||||||||
|
||||||||
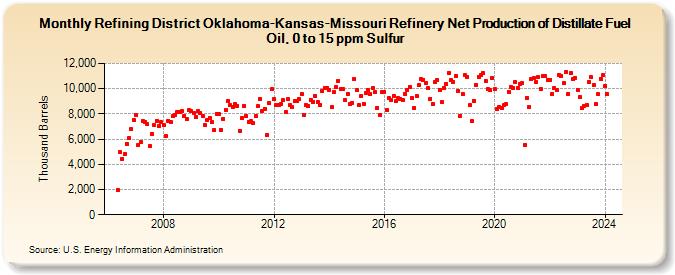
| Refining District Oklahoma-Kansas-Missouri Refinery Net Production of Distillate Fuel Oil, 0 to 15 ppm Sulfur (Thousand Barrels) | ||||||||
| Year | Jan | Feb | Mar | Apr | May | Jun | Jul | Aug | Sep | Oct | Nov | Dec |
|---|---|---|---|---|---|---|---|---|---|---|---|---|
| 2006 | 1,973 | 4,949 | 4,447 | 4,808 | 5,649 | 6,102 | 6,762 | 7,514 | ||||
| 2007 | 7,922 | 5,552 | 5,765 | 7,410 | 7,360 | 7,181 | 5,465 | 6,426 | 7,112 | 7,439 | 7,043 | 7,321 |
| 2008 | 7,100 | 6,245 | 7,438 | 7,320 | 7,796 | 7,874 | 8,170 | 8,126 | 8,207 | 7,858 | 7,611 | 8,305 |
| 2009 | 8,208 | 8,068 | 7,787 | 8,218 | 8,073 | 7,832 | 7,116 | 7,547 | 7,667 | 7,335 | 6,732 | 8,003 |
| 2010 | 7,998 | 6,753 | 7,627 | 8,314 | 9,033 | 8,690 | 8,522 | 8,755 | 8,662 | 6,672 | 7,674 | 8,609 |
| 2011 | 7,817 | 7,384 | 7,413 | 7,272 | 7,838 | 8,597 | 9,190 | 8,244 | 8,414 | 6,337 | 8,859 | 9,948 |
| 2012 | 9,158 | 8,675 | 8,698 | 8,775 | 9,095 | 8,158 | 9,151 | 8,669 | 8,535 | 9,034 | 8,989 | 9,144 |
| 2013 | 9,580 | 7,901 | 8,717 | 8,617 | 9,122 | 8,969 | 9,443 | 8,914 | 8,743 | 9,787 | 10,072 | 10,081 |
| 2014 | 9,922 | 8,540 | 9,730 | 10,171 | 10,641 | 9,992 | 9,977 | 9,075 | 9,586 | 8,757 | 8,900 | 10,772 |
| 2015 | 9,871 | 8,675 | 9,447 | 8,817 | 9,642 | 9,895 | 9,588 | 10,050 | 9,733 | 8,480 | 7,897 | 9,724 |
| 2016 | 9,774 | 8,323 | 9,222 | 9,118 | 9,446 | 8,999 | 9,234 | 9,211 | 9,070 | 9,606 | 9,900 | 10,135 |
| 2017 | 9,246 | 8,483 | 9,421 | 10,287 | 10,733 | 10,715 | 10,487 | 10,027 | 9,218 | 8,794 | 10,553 | 10,715 |
| 2018 | 9,918 | 8,931 | 10,078 | 10,377 | 11,277 | 10,708 | 10,556 | 11,038 | 9,829 | 7,855 | 9,575 | 11,053 |
| 2019 | 10,951 | 8,668 | 7,428 | 9,044 | 10,304 | 10,932 | 11,063 | 11,213 | 10,646 | 9,962 | 9,894 | 10,812 |
| 2020 | 9,961 | 8,405 | 8,568 | 8,496 | 8,679 | 8,751 | 9,764 | 10,172 | 10,039 | 10,538 | 10,072 | 10,406 |
| 2021 | 10,442 | 5,568 | 9,293 | 8,581 | 10,743 | 10,853 | 10,549 | 10,921 | 9,996 | 10,990 | 10,986 | 10,707 |
| 2022 | 10,720 | 9,583 | 10,050 | 9,906 | 11,121 | 10,994 | 10,432 | 11,342 | 9,582 | 11,208 | 10,778 | 10,848 |
| 2023 | 9,915 | 9,353 | 8,476 | 8,602 | 8,719 | 10,539 | 10,901 | 10,275 | 8,782 | 9,554 | 10,803 | 11,053 |
| 2024 | 10,248 | |||||||||||
| - = No Data Reported; -- = Not Applicable; NA = Not Available; W = Withheld to avoid disclosure of individual company data. |
| Release Date: 3/29/2024 |
| Next Release Date: 4/30/2024 |