|
Download Data (XLS File) |
|
||||||||
|
||||||||
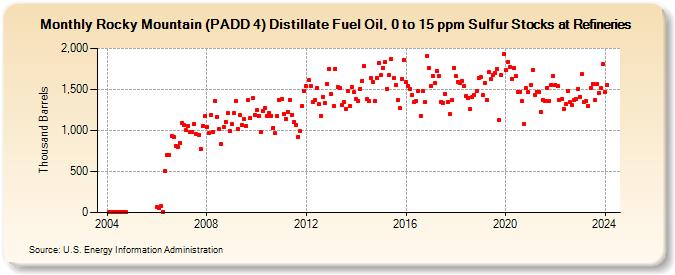
| Rocky Mountain (PADD 4) Distillate Fuel Oil, 0 to 15 ppm Sulfur Stocks at Refineries (Thousand Barrels) | ||||||||
| Year | Jan | Feb | Mar | Apr | May | Jun | Jul | Aug | Sep | Oct | Nov | Dec |
|---|---|---|---|---|---|---|---|---|---|---|---|---|
| 2004 | 9 | 9 | 2 | 1 | 1 | 1 | 1 | 1 | 1 | |||
| 2006 | 62 | 58 | 78 | 4 | 510 | 701 | 701 | 934 | 923 | 812 | 797 | 853 |
| 2007 | 1,096 | 1,071 | 1,001 | 1,058 | 980 | 984 | 1,082 | 952 | 948 | 776 | 1,053 | 1,176 |
| 2008 | 1,045 | 968 | 1,186 | 980 | 1,361 | 1,162 | 1,012 | 836 | 1,044 | 1,108 | 1,211 | 994 |
| 2009 | 1,077 | 1,208 | 1,353 | 1,019 | 1,183 | 1,061 | 1,134 | 1,054 | 1,368 | 1,153 | 1,390 | 1,194 |
| 2010 | 1,244 | 1,178 | 977 | 1,242 | 1,270 | 1,173 | 1,210 | 1,180 | 1,035 | 965 | 1,182 | 1,375 |
| 2011 | 1,378 | 1,205 | 1,141 | 1,229 | 1,373 | 1,193 | 1,105 | 1,069 | 924 | 990 | 1,298 | 1,481 |
| 2012 | 1,536 | 1,610 | 1,540 | 1,348 | 1,371 | 1,516 | 1,319 | 1,180 | 1,412 | 1,334 | 1,567 | 1,755 |
| 2013 | 1,450 | 1,300 | 1,755 | 1,530 | 1,521 | 1,306 | 1,349 | 1,264 | 1,475 | 1,297 | 1,531 | 1,464 |
| 2014 | 1,382 | 1,359 | 1,509 | 1,608 | 1,783 | 1,378 | 1,353 | 1,642 | 1,591 | 1,355 | 1,637 | 1,822 |
| 2015 | 1,678 | 1,762 | 1,831 | 1,510 | 1,679 | 1,876 | 1,635 | 1,549 | 1,368 | 1,269 | 1,629 | 1,863 |
| 2016 | 1,588 | 1,537 | 1,501 | 1,433 | 1,345 | 1,357 | 1,481 | 1,175 | 1,476 | 1,349 | 1,911 | 1,761 |
| 2017 | 1,538 | 1,663 | 1,578 | 1,729 | 1,663 | 1,352 | 1,338 | 1,445 | 1,347 | 1,198 | 1,372 | 1,766 |
| 2018 | 1,659 | 1,595 | 1,573 | 1,605 | 1,538 | 1,419 | 1,399 | 1,261 | 1,413 | 1,437 | 1,482 | 1,642 |
| 2019 | 1,647 | 1,427 | 1,582 | 1,366 | 1,707 | 1,624 | 1,673 | 1,702 | 1,749 | 1,129 | 1,670 | 1,929 |
| 2020 | 1,736 | 1,837 | 1,774 | 1,627 | 1,759 | 1,662 | 1,473 | 1,472 | 1,353 | 1,073 | 1,512 | 1,464 |
| 2021 | 1,557 | 1,736 | 1,434 | 1,472 | 1,466 | 1,225 | 1,372 | 1,364 | 1,522 | 1,363 | 1,554 | 1,659 |
| 2022 | 1,559 | 1,538 | 1,376 | 1,381 | 1,262 | 1,321 | 1,481 | 1,343 | 1,314 | 1,377 | 1,384 | 1,509 |
| 2023 | 1,413 | 1,682 | 1,352 | 1,354 | 1,301 | 1,520 | 1,564 | 1,366 | 1,567 | 1,454 | 1,519 | 1,805 |
| 2024 | 1,468 | |||||||||||
| - = No Data Reported; -- = Not Applicable; NA = Not Available; W = Withheld to avoid disclosure of individual company data. |
| Release Date: 3/29/2024 |
| Next Release Date: 4/30/2024 |