|
Download Data (XLS File) |
|
||||||||
|
||||||||
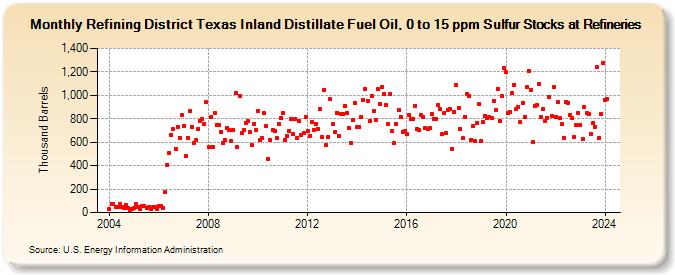
| Refining District Texas Inland Distillate Fuel Oil, 0 to 15 ppm Sulfur Stocks at Refineries (Thousand Barrels) | ||||||||
| Year | Jan | Feb | Mar | Apr | May | Jun | Jul | Aug | Sep | Oct | Nov | Dec |
|---|---|---|---|---|---|---|---|---|---|---|---|---|
| 2004 | 27 | 76 | 71 | 47 | 49 | 69 | 51 | 40 | 68 | 36 | 19 | 33 |
| 2005 | 43 | 69 | 48 | 34 | 60 | 55 | 38 | 50 | 33 | 44 | 46 | 29 |
| 2006 | 58 | 53 | 39 | 174 | 406 | 512 | 660 | 711 | 546 | 732 | 636 | 834 |
| 2007 | 742 | 479 | 636 | 863 | 728 | 595 | 616 | 716 | 782 | 794 | 753 | 940 |
| 2008 | 560 | 811 | 561 | 850 | 744 | 744 | 691 | 590 | 620 | 720 | 701 | 607 |
| 2009 | 702 | 1,019 | 555 | 996 | 676 | 700 | 768 | 777 | 686 | 575 | 759 | 707 |
| 2010 | 866 | 616 | 637 | 845 | 738 | 457 | 616 | 704 | 698 | 638 | 755 | 807 |
| 2011 | 852 | 623 | 653 | 696 | 799 | 669 | 799 | 639 | 779 | 659 | 679 | 815 |
| 2012 | 692 | 657 | 772 | 707 | 754 | 714 | 882 | 645 | 1,049 | 578 | 646 | 966 |
| 2013 | 753 | 683 | 850 | 656 | 843 | 840 | 909 | 849 | 717 | 596 | 787 | 938 |
| 2014 | 726 | 733 | 811 | 960 | 1,054 | 955 | 783 | 992 | 864 | 788 | 1,051 | 929 |
| 2015 | 1,070 | 1,012 | 919 | 753 | 1,015 | 692 | 590 | 759 | 872 | 818 | 689 | 697 |
| 2016 | 669 | 828 | 797 | 799 | 912 | 716 | 705 | 832 | 814 | 724 | 710 | 725 |
| 2017 | 844 | 799 | 796 | 918 | 881 | 667 | 846 | 679 | 872 | 884 | 546 | 858 |
| 2018 | 1,084 | 892 | 716 | 633 | 813 | 1,012 | 995 | 621 | 737 | 606 | 768 | 928 |
| 2019 | 613 | 772 | 823 | 803 | 817 | 807 | 952 | 874 | 1,057 | 777 | 992 | 1,229 |
| 2020 | 1,195 | 849 | 861 | 1,019 | 1,092 | 881 | 898 | 769 | 933 | 817 | 1,069 | 1,210 |
| 2021 | 1,047 | 604 | 908 | 920 | 1,096 | 812 | 882 | 779 | 807 | 982 | 821 | 1,070 |
| 2022 | 813 | 945 | 808 | 751 | 640 | 947 | 937 | 831 | 808 | 646 | 748 | 849 |
| 2023 | 747 | 624 | 904 | 849 | 840 | 673 | 762 | 732 | 1,242 | 634 | 843 | 1,272 |
| 2024 | 961 | |||||||||||
| - = No Data Reported; -- = Not Applicable; NA = Not Available; W = Withheld to avoid disclosure of individual company data. |
| Release Date: 3/29/2024 |
| Next Release Date: 4/30/2024 |