|
Download Data (XLS File) |
|
||||||||
|
||||||||
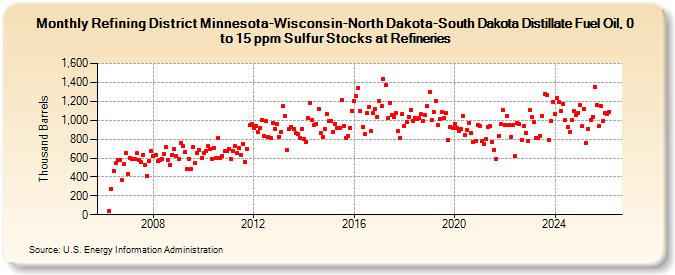
| Refining District Minnesota-Wisconsin-North Dakota-South Dakota Distillate Fuel Oil, 0 to 15 ppm Sulfur Stocks at Refineries (Thousand Barrels) | ||||||||
| Year | Jan | Feb | Mar | Apr | May | Jun | Jul | Aug | Sep | Oct | Nov | Dec |
|---|---|---|---|---|---|---|---|---|---|---|---|---|
| 2006 | 42 | 271 | 463 | 542 | 582 | 582 | 371 | 537 | 654 | |||
| 2007 | 428 | 601 | 591 | 587 | 648 | 581 | 553 | 629 | 526 | 412 | 566 | 678 |
| 2008 | 624 | 630 | 564 | 578 | 593 | 643 | 717 | 574 | 530 | 637 | 691 | 619 |
| 2009 | 588 | 763 | 727 | 661 | 480 | 593 | 482 | 719 | 546 | 650 | 683 | 603 |
| 2010 | 656 | 671 | 723 | 694 | 591 | 710 | 601 | 812 | 602 | 622 | 672 | 673 |
| 2011 | 695 | 591 | 679 | 722 | 649 | 705 | 637 | 752 | 555 | 696 | 944 | 959 |
| 2012 | 921 | 943 | 871 | 918 | 1,000 | 829 | 987 | 826 | 813 | 967 | 912 | 957 |
| 2013 | 826 | 876 | 1,147 | 1,041 | 682 | 908 | 931 | 906 | 863 | 851 | 813 | 912 |
| 2014 | 802 | 773 | 1,024 | 1,187 | 1,004 | 947 | 965 | 1,121 | 869 | 817 | 907 | 1,069 |
| 2015 | 992 | 995 | 879 | 961 | 921 | 914 | 1,213 | 940 | 810 | 828 | 918 | 1,102 |
| 2016 | 1,201 | 1,260 | 1,345 | 1,093 | 933 | 849 | 1,071 | 1,140 | 890 | 1,072 | 1,114 | 1,036 |
| 2017 | 1,200 | 1,150 | 1,439 | 1,368 | 1,020 | 1,187 | 1,052 | 1,034 | 1,075 | 881 | 812 | 1,069 |
| 2018 | 939 | 985 | 1,039 | 1,106 | 988 | 1,021 | 1,013 | 1,019 | 1,064 | 989 | 1,052 | 1,152 |
| 2019 | 1,302 | 997 | 1,091 | 1,203 | 944 | 1,010 | 1,083 | 1,027 | 1,078 | 793 | 932 | 922 |
| 2020 | 965 | 916 | 887 | 909 | 1,043 | 841 | 899 | 973 | 862 | 767 | 775 | 946 |
| 2021 | 938 | 776 | 749 | 797 | 930 | 937 | 770 | 689 | 590 | 829 | 958 | 1,104 |
| 2022 | 948 | 1,044 | 954 | 824 | 949 | 619 | 971 | 956 | 792 | 937 | 869 | 783 |
| 2023 | 1,103 | 1,036 | 980 | 810 | 815 | 834 | 1,045 | 1,272 | 1,269 | 789 | 992 | 1,192 |
| 2024 | 1,068 | 1,233 | 1,189 | 1,098 | 1,170 | 1,007 | ||||||
| - = No Data Reported; -- = Not Applicable; NA = Not Available; W = Withheld to avoid disclosure of individual company data. |
| Release Date: 8/30/2024 |
| Next Release Date: 9/30/2024 |