|
Download Data (XLS File) |
|
||||||||
|
||||||||
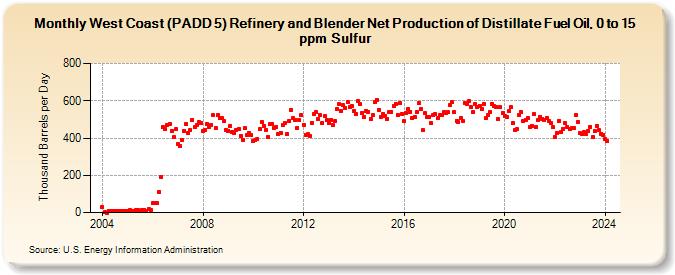
| West Coast (PADD 5) Refinery and Blender Net Production of Distillate Fuel Oil, 0 to 15 ppm Sulfur (Thousand Barrels per Day) | ||||||||
| Year | Jan | Feb | Mar | Apr | May | Jun | Jul | Aug | Sep | Oct | Nov | Dec |
|---|---|---|---|---|---|---|---|---|---|---|---|---|
| 2004 | 29 | 4 | 0 | 9 | 11 | 8 | 7 | 11 | 9 | 8 | 9 | 10 |
| 2005 | 9 | 12 | 8 | 10 | 12 | 12 | 8 | 13 | 14 | 11 | 19 | 12 |
| 2006 | 49 | 53 | 52 | 111 | 189 | 457 | 451 | 471 | 474 | 436 | 404 | 447 |
| 2007 | 369 | 356 | 391 | 440 | 474 | 426 | 443 | 499 | 459 | 470 | 484 | 478 |
| 2008 | 437 | 445 | 474 | 458 | 472 | 522 | 453 | 523 | 506 | 506 | 489 | 444 |
| 2009 | 440 | 466 | 433 | 428 | 442 | 448 | 413 | 392 | 452 | 418 | 427 | 415 |
| 2010 | 386 | 390 | 396 | 446 | 486 | 467 | 443 | 408 | 473 | 476 | 456 | 459 |
| 2011 | 422 | 429 | 471 | 478 | 420 | 491 | 550 | 505 | 499 | 454 | 495 | 523 |
| 2012 | 471 | 418 | 419 | 413 | 483 | 528 | 538 | 503 | 522 | 481 | 519 | 497 |
| 2013 | 482 | 499 | 471 | 489 | 557 | 580 | 546 | 575 | 560 | 592 | 567 | 573 |
| 2014 | 547 | 529 | 596 | 582 | 535 | 513 | 545 | 540 | 503 | 521 | 593 | 606 |
| 2015 | 551 | 515 | 531 | 519 | 504 | 538 | 540 | 572 | 583 | 524 | 587 | 529 |
| 2016 | 491 | 534 | 557 | 542 | 510 | 515 | 538 | 586 | 554 | 441 | 532 | 512 |
| 2017 | 513 | 478 | 522 | 528 | 506 | 522 | 525 | 537 | 535 | 537 | 578 | 593 |
| 2018 | 537 | 491 | 485 | 507 | 494 | 589 | 580 | 597 | 565 | 539 | 581 | 568 |
| 2019 | 574 | 557 | 582 | 506 | 522 | 538 | 583 | 573 | 568 | 500 | 565 | 534 |
| 2020 | 520 | 513 | 544 | 564 | 482 | 441 | 447 | 526 | 537 | 489 | 499 | 510 |
| 2021 | 457 | 466 | 527 | 457 | 495 | 513 | 504 | 498 | 507 | 491 | 479 | 458 |
| 2022 | 404 | 426 | 494 | 434 | 450 | 479 | 460 | 446 | 454 | 456 | 522 | 488 |
| 2023 | 425 | 420 | 430 | 423 | 440 | 460 | 405 | 437 | 465 | 441 | 424 | 418 |
| 2024 | 397 | |||||||||||
| - = No Data Reported; -- = Not Applicable; NA = Not Available; W = Withheld to avoid disclosure of individual company data. |
| Release Date: 3/29/2024 |
| Next Release Date: 4/30/2024 |