|
Download Data (XLS File) |
|
||||||||
|
||||||||
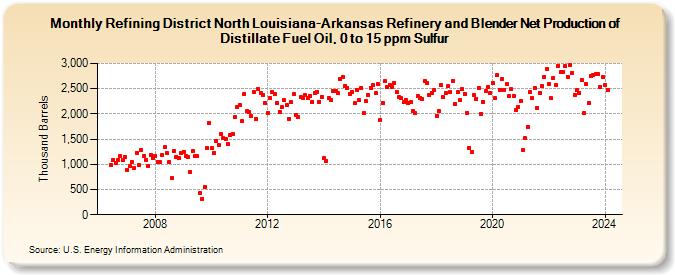
| Refining District North Louisiana-Arkansas Refinery and Blender Net Production of Distillate Fuel Oil, 0 to 15 ppm Sulfur (Thousand Barrels) | ||||||||
| Year | Jan | Feb | Mar | Apr | May | Jun | Jul | Aug | Sep | Oct | Nov | Dec |
|---|---|---|---|---|---|---|---|---|---|---|---|---|
| 2006 | 989 | 1,093 | 1,034 | 1,089 | 1,161 | 1,087 | 1,147 | |||||
| 2007 | 894 | 966 | 1,044 | 935 | 1,231 | 991 | 1,292 | 1,173 | 1,093 | 973 | 1,194 | 1,123 |
| 2008 | 1,170 | 1,055 | 1,036 | 1,175 | 1,334 | 1,223 | 1,047 | 726 | 1,267 | 1,146 | 1,120 | 1,223 |
| 2009 | 1,250 | 1,165 | 1,148 | 856 | 1,255 | 1,162 | 1,155 | 425 | 314 | 545 | 1,321 | 1,824 |
| 2010 | 1,316 | 1,230 | 1,472 | 1,391 | 1,592 | 1,521 | 1,503 | 1,407 | 1,574 | 1,607 | 1,931 | 2,138 |
| 2011 | 2,171 | 1,851 | 2,393 | 2,049 | 2,042 | 1,957 | 2,431 | 1,895 | 2,492 | 2,424 | 2,382 | 2,209 |
| 2012 | 2,020 | 2,315 | 2,428 | 2,386 | 2,220 | 2,047 | 2,134 | 2,269 | 2,180 | 1,905 | 2,229 | 2,394 |
| 2013 | 1,978 | 1,937 | 2,328 | 2,311 | 2,371 | 2,310 | 2,360 | 2,242 | 2,416 | 2,441 | 2,243 | 2,342 |
| 2014 | 1,117 | 1,063 | 2,311 | 2,275 | 2,455 | 2,460 | 2,412 | 2,697 | 2,731 | 2,554 | 2,511 | 2,401 |
| 2015 | 2,438 | 2,207 | 2,481 | 2,274 | 2,518 | 2,013 | 2,246 | 2,377 | 2,520 | 2,578 | 2,408 | 2,596 |
| 2016 | 1,887 | 2,215 | 2,651 | 2,542 | 2,578 | 2,543 | 2,608 | 2,436 | 2,332 | 2,307 | 2,227 | 2,271 |
| 2017 | 2,207 | 2,244 | 2,066 | 2,017 | 2,349 | 2,316 | 2,290 | 2,657 | 2,615 | 2,365 | 2,416 | 2,472 |
| 2018 | 1,965 | 2,048 | 2,566 | 2,329 | 2,405 | 2,553 | 2,430 | 2,662 | 2,206 | 2,431 | 2,279 | 2,498 |
| 2019 | 2,402 | 2,021 | 1,326 | 1,248 | 2,381 | 2,305 | 2,511 | 1,999 | 2,237 | 2,451 | 2,540 | 2,411 |
| 2020 | 2,610 | 2,315 | 2,765 | 2,480 | 2,694 | 2,478 | 2,596 | 2,350 | 2,490 | 2,361 | 2,075 | 2,141 |
| 2021 | 2,260 | 1,276 | 1,512 | 1,749 | 2,427 | 2,310 | 2,511 | 2,122 | 2,412 | 2,548 | 2,733 | 2,884 |
| 2022 | 2,600 | 2,309 | 2,717 | 2,564 | 2,959 | 2,828 | 2,829 | 2,953 | 2,741 | 2,965 | 2,808 | 2,384 |
| 2023 | 2,468 | 2,416 | 2,679 | 2,012 | 2,600 | 2,223 | 2,758 | 2,770 | 2,782 | 2,784 | 2,529 | 2,731 |
| 2024 | 2,579 | 2,483 | ||||||||||
| - = No Data Reported; -- = Not Applicable; NA = Not Available; W = Withheld to avoid disclosure of individual company data. |
| Release Date: 4/30/2024 |
| Next Release Date: 5/31/2024 |