|
Download Data (XLS File) |
|
||||||||
|
||||||||
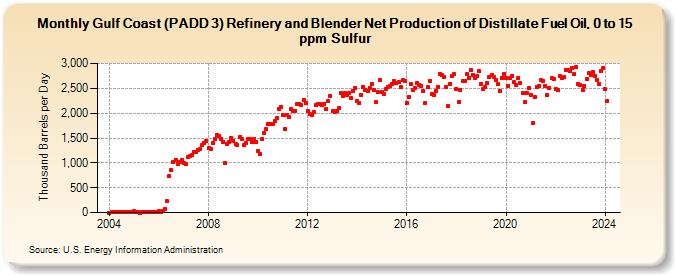
| Gulf Coast (PADD 3) Refinery and Blender Net Production of Distillate Fuel Oil, 0 to 15 ppm Sulfur (Thousand Barrels per Day) | ||||||||
| Year | Jan | Feb | Mar | Apr | May | Jun | Jul | Aug | Sep | Oct | Nov | Dec |
|---|---|---|---|---|---|---|---|---|---|---|---|---|
| 2004 | 1 | 3 | 5 | 2 | 13 | 4 | 3 | 3 | 8 | 5 | 13 | 21 |
| 2005 | 24 | 4 | 2 | 1 | 3 | 15 | 9 | 5 | 3 | 5 | 6 | 11 |
| 2006 | 27 | 12 | 28 | 76 | 224 | 728 | 856 | 1,022 | 1,059 | 985 | 1,013 | 1,063 |
| 2007 | 988 | 980 | 1,112 | 1,144 | 1,153 | 1,227 | 1,216 | 1,249 | 1,279 | 1,351 | 1,399 | 1,431 |
| 2008 | 1,297 | 1,276 | 1,391 | 1,486 | 1,551 | 1,531 | 1,487 | 1,425 | 995 | 1,383 | 1,429 | 1,497 |
| 2009 | 1,446 | 1,381 | 1,360 | 1,521 | 1,482 | 1,353 | 1,397 | 1,487 | 1,476 | 1,410 | 1,479 | 1,420 |
| 2010 | 1,236 | 1,187 | 1,483 | 1,594 | 1,681 | 1,777 | 1,791 | 1,788 | 1,834 | 1,898 | 2,079 | 2,128 |
| 2011 | 1,960 | 1,687 | 1,971 | 1,919 | 2,083 | 2,036 | 2,052 | 2,175 | 2,188 | 2,158 | 2,269 | 2,201 |
| 2012 | 2,049 | 1,974 | 1,973 | 2,024 | 2,162 | 2,179 | 2,175 | 2,160 | 2,181 | 2,082 | 2,235 | 2,350 |
| 2013 | 2,037 | 2,024 | 2,044 | 2,098 | 2,402 | 2,340 | 2,405 | 2,366 | 2,397 | 2,301 | 2,439 | 2,513 |
| 2014 | 2,251 | 2,198 | 2,370 | 2,523 | 2,476 | 2,445 | 2,507 | 2,591 | 2,469 | 2,216 | 2,434 | 2,666 |
| 2015 | 2,432 | 2,384 | 2,487 | 2,527 | 2,544 | 2,585 | 2,639 | 2,603 | 2,618 | 2,517 | 2,666 | 2,646 |
| 2016 | 2,197 | 2,321 | 2,581 | 2,464 | 2,502 | 2,603 | 2,571 | 2,546 | 2,446 | 2,195 | 2,523 | 2,654 |
| 2017 | 2,392 | 2,368 | 2,444 | 2,535 | 2,796 | 2,761 | 2,719 | 2,532 | 2,144 | 2,593 | 2,751 | 2,779 |
| 2018 | 2,488 | 2,225 | 2,471 | 2,649 | 2,657 | 2,782 | 2,717 | 2,862 | 2,776 | 2,709 | 2,740 | 2,841 |
| 2019 | 2,584 | 2,496 | 2,523 | 2,606 | 2,722 | 2,766 | 2,725 | 2,677 | 2,580 | 2,453 | 2,717 | 2,782 |
| 2020 | 2,699 | 2,549 | 2,702 | 2,757 | 2,622 | 2,565 | 2,709 | 2,606 | 2,408 | 2,217 | 2,415 | 2,497 |
| 2021 | 2,362 | 1,807 | 2,320 | 2,535 | 2,547 | 2,667 | 2,641 | 2,545 | 2,367 | 2,516 | 2,705 | 2,683 |
| 2022 | 2,483 | 2,469 | 2,750 | 2,705 | 2,720 | 2,863 | 2,872 | 2,843 | 2,900 | 2,786 | 2,922 | 2,597 |
| 2023 | 2,570 | 2,475 | 2,543 | 2,683 | 2,799 | 2,778 | 2,835 | 2,746 | 2,661 | 2,588 | 2,851 | 2,915 |
| 2024 | 2,482 | |||||||||||
| - = No Data Reported; -- = Not Applicable; NA = Not Available; W = Withheld to avoid disclosure of individual company data. |
| Release Date: 3/29/2024 |
| Next Release Date: 4/30/2024 |