|
Download Data (XLS File) |
|
||||||||
|
||||||||
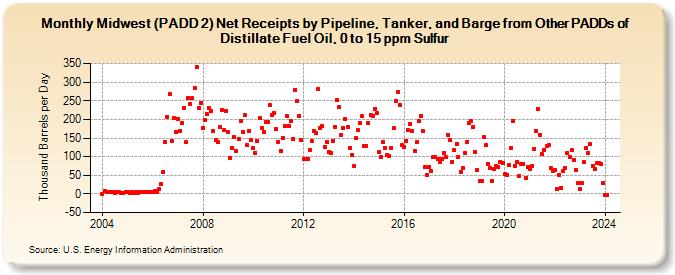
| Midwest (PADD 2) Net Receipts by Pipeline, Tanker, and Barge from Other PADDs of Distillate Fuel Oil, 0 to 15 ppm Sulfur (Thousand Barrels per Day) | ||||||||
| Year | Jan | Feb | Mar | Apr | May | Jun | Jul | Aug | Sep | Oct | Nov | Dec |
|---|---|---|---|---|---|---|---|---|---|---|---|---|
| 2004 | -1 | 8 | 6 | 4 | 4 | 4 | 3 | 4 | 4 | 2 | 3 | 4 |
| 2005 | 5 | 3 | 4 | 3 | 6 | 3 | 4 | 5 | 5 | 4 | 5 | 4 |
| 2006 | 5 | 8 | 6 | 12 | 27 | 60 | 139 | 207 | 267 | 143 | 204 | 166 |
| 2007 | 202 | 170 | 190 | 230 | 139 | 257 | 240 | 257 | 285 | 340 | 231 | 245 |
| 2008 | 177 | 199 | 214 | 230 | 223 | 169 | 146 | 138 | 179 | 226 | 172 | 223 |
| 2009 | 165 | 96 | 124 | 152 | 115 | 147 | 196 | 167 | 212 | 131 | 170 | 144 |
| 2010 | 122 | 111 | 141 | 204 | 178 | 165 | 194 | 192 | 238 | 212 | 217 | 174 |
| 2011 | 140 | 116 | 150 | 181 | 209 | 181 | 197 | 147 | 280 | 248 | 210 | 144 |
| 2012 | 93 | 95 | 95 | 118 | 142 | 169 | 164 | 281 | 177 | 181 | 126 | 140 |
| 2013 | 112 | 111 | 143 | 179 | 252 | 232 | 159 | 177 | 201 | 180 | 124 | 104 |
| 2014 | 74 | 149 | 172 | 189 | 208 | 128 | 129 | 190 | 211 | 208 | 229 | 216 |
| 2015 | 113 | 98 | 138 | 123 | 104 | 103 | 124 | 176 | 250 | 273 | 238 | 131 |
| 2016 | 127 | 143 | 171 | 188 | 169 | 116 | 139 | 197 | 210 | 168 | 71 | 52 |
| 2017 | 73 | 62 | 99 | 100 | 94 | 86 | 93 | 109 | 100 | 158 | 144 | 87 |
| 2018 | 117 | 134 | 99 | 60 | 70 | 110 | 139 | 190 | 197 | 180 | 112 | 64 |
| 2019 | 34 | 35 | 152 | 131 | 80 | 69 | 35 | 67 | 76 | 71 | 87 | 84 |
| 2020 | 53 | 52 | 78 | 123 | 196 | 75 | 87 | 49 | 80 | 80 | 43 | 72 |
| 2021 | 67 | 75 | 121 | 170 | 228 | 159 | 106 | 118 | 129 | 131 | 69 | 62 |
| 2022 | 63 | 12 | 52 | 17 | 62 | 69 | 110 | 99 | 117 | 90 | 63 | 29 |
| 2023 | 12 | 30 | 86 | 124 | 111 | 133 | 75 | 68 | 82 | 84 | 79 | 30 |
| 2024 | -2 | |||||||||||
| - = No Data Reported; -- = Not Applicable; NA = Not Available; W = Withheld to avoid disclosure of individual company data. |
| Release Date: 3/29/2024 |
| Next Release Date: 4/30/2024 |