|
Download Data (XLS File) |
|
||||||||
|
||||||||
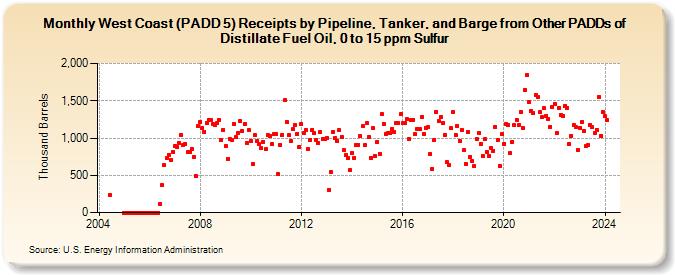
| West Coast (PADD 5) Receipts by Pipeline, Tanker, and Barge from Other PADDs of Distillate Fuel Oil, 0 to 15 ppm Sulfur (Thousand Barrels) | ||||||||
| Year | Jan | Feb | Mar | Apr | May | Jun | Jul | Aug | Sep | Oct | Nov | Dec |
|---|---|---|---|---|---|---|---|---|---|---|---|---|
| 2004 | 239 | |||||||||||
| 2005 | 0 | 0 | 0 | 0 | 0 | 0 | 0 | 0 | 0 | 0 | 0 | 0 |
| 2006 | 0 | 0 | 0 | 0 | 0 | 118 | 364 | 633 | 736 | 778 | 711 | 815 |
| 2007 | 894 | 880 | 939 | 1,042 | 910 | 917 | 808 | 809 | 856 | 746 | 488 | 1,163 |
| 2008 | 1,221 | 1,141 | 1,087 | 1,202 | 1,245 | 1,247 | 1,188 | 1,178 | 1,207 | 1,246 | 971 | 1,108 |
| 2009 | 896 | 725 | 989 | 968 | 1,191 | 1,011 | 1,074 | 1,227 | 1,097 | 1,190 | 930 | 1,110 |
| 2010 | 963 | 653 | 1,035 | 955 | 915 | 864 | 952 | 847 | 1,041 | 1,030 | 914 | 1,050 |
| 2011 | 1,060 | 514 | 911 | 1,047 | 1,505 | 1,217 | 1,038 | 955 | 1,124 | 1,175 | 1,053 | 886 |
| 2012 | 1,188 | 1,066 | 1,107 | 846 | 973 | 1,111 | 1,070 | 976 | 939 | 1,079 | 992 | 981 |
| 2013 | 1,004 | 307 | 541 | 1,086 | 998 | 965 | 1,103 | 1,020 | 842 | 766 | 736 | 572 |
| 2014 | 800 | 738 | 913 | 909 | 1,023 | 1,155 | 900 | 1,201 | 1,014 | 733 | 1,128 | 753 |
| 2015 | 949 | 791 | 1,318 | 1,192 | 1,058 | 1,068 | 1,063 | 1,125 | 1,082 | 1,207 | 1,200 | 1,318 |
| 2016 | 1,197 | 1,202 | 1,251 | 989 | 1,243 | 1,248 | 1,052 | 1,127 | 1,118 | 1,283 | 1,058 | 1,141 |
| 2017 | 1,144 | 788 | 591 | 976 | 1,353 | 1,228 | 1,285 | 1,200 | 1,047 | 677 | 633 | 1,129 |
| 2018 | 1,346 | 1,042 | 1,160 | 961 | 1,113 | 833 | 653 | 1,079 | 752 | 694 | 623 | 989 |
| 2019 | 1,065 | 926 | 759 | 982 | 807 | 763 | 866 | 831 | 1,145 | 975 | 629 | 1,048 |
| 2020 | 921 | 1,184 | 1,176 | 794 | 953 | 1,171 | 1,243 | 1,174 | 1,354 | 1,134 | 1,649 | 1,840 |
| 2021 | 1,484 | 1,361 | 1,335 | 1,575 | 1,557 | 1,343 | 1,277 | 1,401 | 1,301 | 1,256 | 1,150 | 1,411 |
| 2022 | 1,459 | 1,067 | 1,407 | 1,313 | 1,301 | 1,434 | 1,403 | 918 | 1,033 | 1,169 | 1,153 | 845 |
| 2023 | 1,137 | 1,216 | 1,091 | 895 | 906 | 1,173 | 1,142 | 1,073 | 1,111 | 1,556 | 1,030 | 1,352 |
| 2024 | 1,292 | |||||||||||
| - = No Data Reported; -- = Not Applicable; NA = Not Available; W = Withheld to avoid disclosure of individual company data. |
| Release Date: 3/29/2024 |
| Next Release Date: 4/30/2024 |
Referring Pages: