|
Download Data (XLS File) |
|
||||||||
|
||||||||
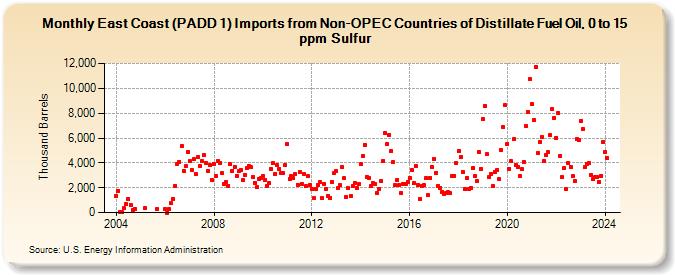
| East Coast (PADD 1) Imports from Non-OPEC Countries of Distillate Fuel Oil, 0 to 15 ppm Sulfur (Thousand Barrels) | ||||||||
| Year | Jan | Feb | Mar | Apr | May | Jun | Jul | Aug | Sep | Oct | Nov | Dec |
|---|---|---|---|---|---|---|---|---|---|---|---|---|
| 2004 | 1,325 | 1,770 | 21 | 18 | 336 | 705 | 1,093 | 624 | 245 | 291 | ||
| 2005 | 329 | 260 | ||||||||||
| 2006 | 287 | 2 | 276 | 741 | 1,118 | 2,175 | 3,941 | 4,075 | 5,392 | 3,380 | 3,711 | 4,907 |
| 2007 | 4,141 | 3,447 | 4,291 | 3,119 | 4,492 | 3,776 | 4,116 | 4,624 | 4,011 | 3,380 | 3,813 | 2,649 |
| 2008 | 3,909 | 2,904 | 4,150 | 3,988 | 3,161 | 2,318 | 2,446 | 2,172 | 3,878 | 3,369 | 3,688 | 2,924 |
| 2009 | 3,322 | 3,434 | 2,616 | 3,053 | 3,551 | 3,785 | 3,630 | 2,877 | 2,409 | 2,021 | 2,713 | 2,818 |
| 2010 | 2,958 | 2,652 | 2,152 | 2,398 | 3,513 | 4,000 | 3,123 | 3,805 | 3,529 | 3,161 | 3,190 | 3,818 |
| 2011 | 5,513 | 2,690 | 2,935 | 2,794 | 3,095 | 2,242 | 3,274 | 2,327 | 3,109 | 2,122 | 2,903 | 2,247 |
| 2012 | 1,933 | 1,141 | 1,898 | 2,255 | 2,423 | 1,151 | 2,311 | 1,921 | 1,359 | 1,209 | 2,443 | 3,195 |
| 2013 | 3,321 | 1,979 | 2,180 | 3,663 | 2,760 | 1,258 | 1,950 | 1,320 | 2,147 | 2,394 | 1,993 | 2,285 |
| 2014 | 3,882 | 4,545 | 5,471 | 2,896 | 2,786 | 2,140 | 2,400 | 2,292 | 1,566 | 1,909 | 2,539 | 4,190 |
| 2015 | 6,420 | 5,497 | 6,231 | 4,959 | 4,043 | 2,179 | 2,622 | 2,223 | 1,573 | 2,278 | 2,321 | 2,423 |
| 2016 | 2,810 | 3,421 | 2,370 | 3,741 | 2,250 | 1,075 | 2,173 | 2,210 | 2,752 | 1,390 | 2,812 | 3,671 |
| 2017 | 4,347 | 3,209 | 2,146 | 2,000 | 1,670 | 1,496 | 1,557 | 1,630 | 1,545 | 2,983 | 2,978 | 3,986 |
| 2018 | 4,954 | 4,495 | 3,255 | 1,900 | 2,810 | 1,880 | 2,015 | 3,562 | 2,930 | 2,540 | 4,904 | 3,516 |
| 2019 | 7,531 | 8,560 | 4,685 | 2,827 | 3,117 | 2,117 | 3,299 | 3,439 | 2,693 | 5,009 | 6,859 | 8,636 |
| 2020 | 5,544 | 3,536 | 4,117 | 5,899 | 3,831 | 3,700 | 2,928 | 3,507 | 4,093 | 6,969 | 8,090 | 10,749 |
| 2021 | 8,701 | 7,486 | 11,716 | 4,795 | 5,695 | 6,078 | 4,150 | 4,615 | 4,852 | 6,204 | 8,337 | 7,646 |
| 2022 | 6,040 | 8,032 | 4,574 | 2,832 | 3,595 | 1,896 | 4,020 | 3,679 | 2,920 | 2,529 | 5,885 | 5,817 |
| 2023 | 7,383 | 6,688 | 3,648 | 3,942 | 3,995 | 3,024 | 2,714 | 2,827 | 2,823 | 2,494 | 2,962 | 5,694 |
| 2024 | 4,841 | |||||||||||
| - = No Data Reported; -- = Not Applicable; NA = Not Available; W = Withheld to avoid disclosure of individual company data. |
| Release Date: 3/29/2024 |
| Next Release Date: 4/30/2024 |