|
Download Data (XLS File) |
|
||||||||
|
||||||||
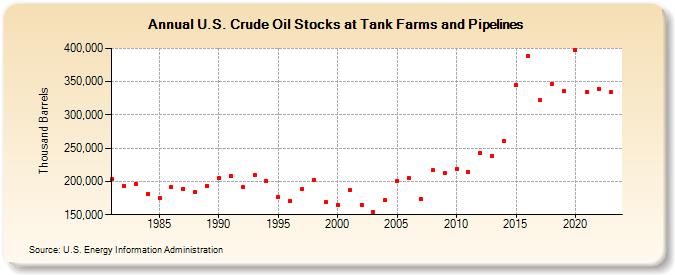
| U.S. Crude Oil Stocks at Tank Farms and Pipelines (Thousand Barrels) | ||||||||
| Decade | Year-0 | Year-1 | Year-2 | Year-3 | Year-4 | Year-5 | Year-6 | Year-7 | Year-8 | Year-9 |
|---|---|---|---|---|---|---|---|---|---|---|
| 1980's | 203,086 | 193,301 | 196,270 | 181,390 | 175,450 | 192,027 | 189,391 | 183,514 | 193,681 | |
| 1990's | 204,604 | 208,443 | 190,910 | 209,475 | 200,751 | 176,326 | 170,479 | 188,580 | 202,272 | 168,645 |
| 2000's | 165,004 | 187,512 | 164,639 | 154,688 | 171,404 | 200,578 | 204,894 | 174,050 | 216,550 | 212,168 |
| 2010's | 218,783 | 214,430 | 242,665 | 238,499 | 261,120 | 344,259 | 387,832 | 321,901 | 346,307 | 335,628 |
| 2020's | 397,861 | 334,801 | 339,599 | 334,213 |
| - = No Data Reported; -- = Not Applicable; NA = Not Available; W = Withheld to avoid disclosure of individual company data. |
| Release Date: 8/30/2024 |
| Next Release Date: 8/29/2025 |