|
Download Data (XLS File) |
|
||||||||
|
||||||||
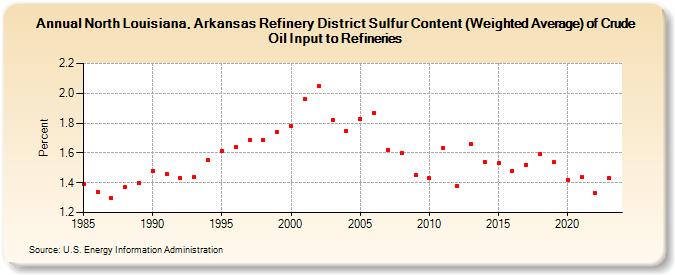
| North Louisiana, Arkansas Refinery District Sulfur Content (Weighted Average) of Crude Oil Input to Refineries (Percent) | ||||||||
| Decade | Year-0 | Year-1 | Year-2 | Year-3 | Year-4 | Year-5 | Year-6 | Year-7 | Year-8 | Year-9 |
|---|---|---|---|---|---|---|---|---|---|---|
| 1980's | 1.39 | 1.34 | 1.30 | 1.37 | 1.40 | |||||
| 1990's | 1.48 | 1.46 | 1.43 | 1.44 | 1.55 | 1.61 | 1.64 | 1.69 | 1.69 | 1.74 |
| 2000's | 1.78 | 1.96 | 2.05 | 1.82 | 1.75 | 1.83 | 1.87 | 1.62 | 1.60 | 1.45 |
| 2010's | 1.43 | 1.63 | 1.38 | 1.66 | 1.54 | 1.53 | 1.48 | 1.52 | 1.59 | 1.54 |
| 2020's | 1.42 | 1.44 | 1.33 | 1.43 |
| - = No Data Reported; -- = Not Applicable; NA = Not Available; W = Withheld to avoid disclosure of individual company data. |
| Release Date: 3/29/2024 |
| Next Release Date: 8/30/2024 |