|
Download Data (XLS File) |
|
||||||||
|
||||||||
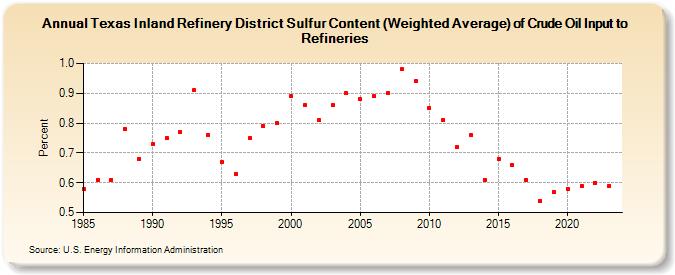
| Texas Inland Refinery District Sulfur Content (Weighted Average) of Crude Oil Input to Refineries (Percent) | ||||||||
| Decade | Year-0 | Year-1 | Year-2 | Year-3 | Year-4 | Year-5 | Year-6 | Year-7 | Year-8 | Year-9 |
|---|---|---|---|---|---|---|---|---|---|---|
| 1980's | 0.58 | 0.61 | 0.61 | 0.78 | 0.68 | |||||
| 1990's | 0.73 | 0.75 | 0.77 | 0.91 | 0.76 | 0.67 | 0.63 | 0.75 | 0.79 | 0.80 |
| 2000's | 0.89 | 0.86 | 0.81 | 0.86 | 0.90 | 0.88 | 0.89 | 0.90 | 0.98 | 0.94 |
| 2010's | 0.85 | 0.81 | 0.72 | 0.76 | 0.61 | 0.68 | 0.66 | 0.61 | 0.54 | 0.57 |
| 2020's | 0.58 | 0.59 | 0.60 | 0.59 |
| - = No Data Reported; -- = Not Applicable; NA = Not Available; W = Withheld to avoid disclosure of individual company data. |
| Release Date: 3/29/2024 |
| Next Release Date: 8/30/2024 |