|
Download Data (XLS File) |
|
||||||||
|
||||||||
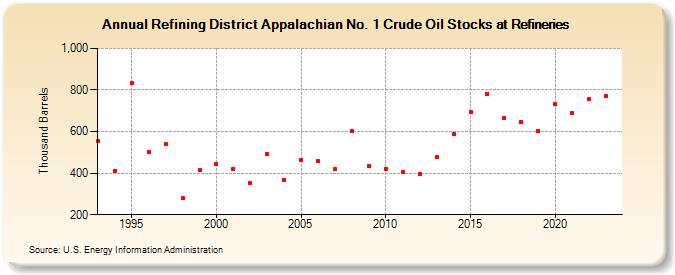
| Refining District Appalachian No. 1 Crude Oil Stocks at Refineries (Thousand Barrels) | ||||||||
| Decade | Year-0 | Year-1 | Year-2 | Year-3 | Year-4 | Year-5 | Year-6 | Year-7 | Year-8 | Year-9 |
|---|---|---|---|---|---|---|---|---|---|---|
| 1990's | 556 | 412 | 833 | 501 | 541 | 279 | 416 | |||
| 2000's | 445 | 420 | 353 | 492 | 369 | 465 | 458 | 418 | 601 | 435 |
| 2010's | 419 | 404 | 398 | 476 | 589 | 694 | 782 | 666 | 646 | 604 |
| 2020's | 731 | 687 | 756 | 769 |
| - = No Data Reported; -- = Not Applicable; NA = Not Available; W = Withheld to avoid disclosure of individual company data. |
| Release Date: 8/30/2024 |
| Next Release Date: 8/29/2025 |
Referring Pages: