|
Download Data (XLS File) |
|
||||||||
|
||||||||
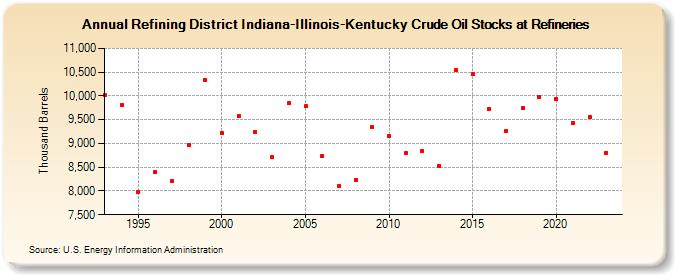
| Refining District Indiana-Illinois-Kentucky Crude Oil Stocks at Refineries (Thousand Barrels) | ||||||||
| Decade | Year-0 | Year-1 | Year-2 | Year-3 | Year-4 | Year-5 | Year-6 | Year-7 | Year-8 | Year-9 |
|---|---|---|---|---|---|---|---|---|---|---|
| 1990's | 10,014 | 9,806 | 7,987 | 8,398 | 8,206 | 8,964 | 10,330 | |||
| 2000's | 9,219 | 9,582 | 9,241 | 8,722 | 9,845 | 9,779 | 8,736 | 8,104 | 8,231 | 9,348 |
| 2010's | 9,154 | 8,792 | 8,842 | 8,532 | 10,537 | 10,455 | 9,722 | 9,268 | 9,745 | 9,987 |
| 2020's | 9,933 | 9,439 | 9,555 | 8,808 |
| - = No Data Reported; -- = Not Applicable; NA = Not Available; W = Withheld to avoid disclosure of individual company data. |
| Release Date: 8/30/2024 |
| Next Release Date: 8/29/2025 |