|
Download Data (XLS File) |
|
||||||||
|
||||||||
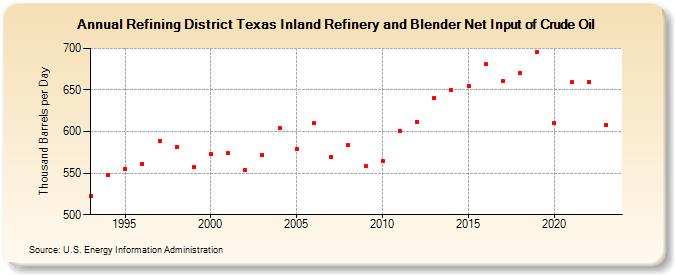
| Refining District Texas Inland Refinery and Blender Net Input of Crude Oil (Thousand Barrels per Day) | ||||||||
| Decade | Year-0 | Year-1 | Year-2 | Year-3 | Year-4 | Year-5 | Year-6 | Year-7 | Year-8 | Year-9 |
|---|---|---|---|---|---|---|---|---|---|---|
| 1990's | 522 | 548 | 555 | 561 | 589 | 582 | 557 | |||
| 2000's | 573 | 574 | 554 | 572 | 604 | 579 | 610 | 570 | 584 | 558 |
| 2010's | 565 | 601 | 612 | 640 | 650 | 655 | 681 | 661 | 671 | 696 |
| 2020's | 610 | 659 | 660 | 608 |
| - = No Data Reported; -- = Not Applicable; NA = Not Available; W = Withheld to avoid disclosure of individual company data. |
| Release Date: 3/29/2024 |
| Next Release Date: 8/30/2024 |