|
Download Data (XLS File) |
|
||||||||
|
||||||||
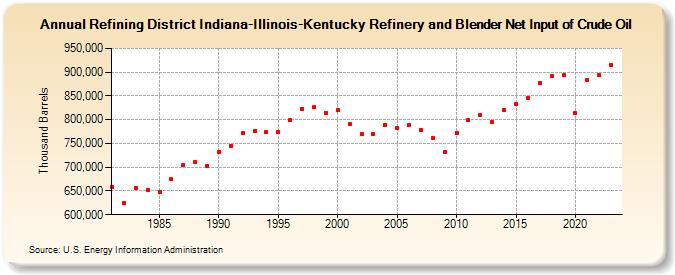
| Refining District Indiana-Illinois-Kentucky Refinery and Blender Net Input of Crude Oil (Thousand Barrels) | ||||||||
| Decade | Year-0 | Year-1 | Year-2 | Year-3 | Year-4 | Year-5 | Year-6 | Year-7 | Year-8 | Year-9 |
|---|---|---|---|---|---|---|---|---|---|---|
| 1980's | 658,009 | 625,430 | 656,235 | 653,039 | 648,608 | 674,122 | 704,242 | 711,617 | 703,180 | |
| 1990's | 732,562 | 744,607 | 772,033 | 775,922 | 773,757 | 774,121 | 798,601 | 823,332 | 826,128 | 814,685 |
| 2000's | 819,381 | 790,360 | 769,594 | 769,004 | 789,387 | 782,156 | 788,704 | 777,729 | 760,984 | 731,339 |
| 2010's | 771,921 | 799,702 | 808,927 | 795,962 | 819,971 | 833,934 | 846,547 | 877,925 | 891,941 | 893,503 |
| 2020's | 813,350 | 883,054 | 893,196 | 914,928 |
| - = No Data Reported; -- = Not Applicable; NA = Not Available; W = Withheld to avoid disclosure of individual company data. |
| Release Date: 3/29/2024 |
| Next Release Date: 8/30/2024 |