|
Download Data (XLS File) |
|
||||||||
|
||||||||
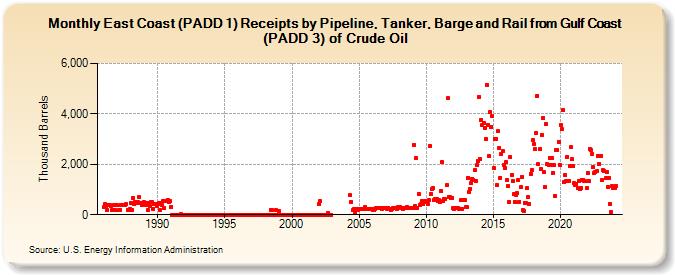
| East Coast (PADD 1) Receipts by Pipeline, Tanker, Barge and Rail from Gulf Coast (PADD 3) of Crude Oil (Thousand Barrels) | ||||||||
| Year | Jan | Feb | Mar | Apr | May | Jun | Jul | Aug | Sep | Oct | Nov | Dec |
|---|---|---|---|---|---|---|---|---|---|---|---|---|
| 1986 | 290 | 412 | 336 | 190 | 381 | 400 | 365 | 174 | 190 | 369 | 184 | 369 |
| 1987 | 375 | 186 | 206 | 405 | 391 | 391 | 397 | 395 | 409 | 205 | 202 | 227 |
| 1988 | 474 | 201 | 656 | 419 | 487 | 460 | 504 | 690 | 473 | 454 | 380 | 431 |
| 1989 | 490 | 395 | 445 | 180 | 462 | 328 | 488 | 493 | 242 | 433 | 444 | 349 |
| 1990 | 414 | 454 | 185 | 461 | 389 | 560 | 262 | 528 | 563 | 582 | 505 | 544 |
| 1991 | 323 | 0 | 0 | 0 | 0 | 0 | 0 | 0 | 0 | 10 | 0 | 0 |
| 1992 | 0 | 0 | 0 | 0 | 0 | 0 | 0 | 0 | 0 | 0 | 0 | 0 |
| 1993 | 0 | 0 | 0 | 0 | 0 | 0 | 0 | 0 | 0 | 0 | 0 | 0 |
| 1994 | 0 | 0 | 0 | 0 | 0 | 0 | 0 | 0 | 0 | 0 | 0 | 0 |
| 1995 | 0 | 0 | 0 | 0 | 0 | 0 | 0 | 0 | 0 | 0 | 0 | 0 |
| 1996 | 0 | 0 | 0 | 0 | 0 | 0 | 0 | 0 | 0 | 0 | 0 | 0 |
| 1997 | 0 | 0 | 0 | 0 | 0 | 0 | 0 | 0 | 0 | 0 | 0 | 0 |
| 1998 | 0 | 0 | 0 | 0 | 0 | 179 | 182 | 0 | 0 | 0 | 171 | 0 |
| 1999 | 145 | 0 | 0 | 0 | 0 | 0 | 0 | 0 | 0 | 0 | 0 | 0 |
| 2000 | 0 | 0 | 0 | 0 | 0 | 0 | 0 | 0 | 0 | 0 | 0 | 0 |
| 2001 | 0 | 0 | 0 | 0 | 0 | 0 | 0 | 0 | 0 | 0 | 0 | 0 |
| 2002 | 424 | 525 | 0 | 0 | 0 | 0 | 0 | 0 | 53 | 0 | 0 | 0 |
| 2004 | 772 | 500 | 170 | 209 | 101 | 213 | 219 | 204 | ||||
| 2005 | 231 | 218 | 236 | 222 | 227 | 288 | 221 | 207 | 227 | 228 | 214 | 231 |
| 2006 | 187 | 194 | 241 | 259 | 250 | 258 | 277 | 270 | 242 | 273 | 258 | 269 |
| 2007 | 264 | 231 | 281 | 235 | 200 | 233 | 260 | 275 | 258 | 269 | 234 | 309 |
| 2008 | 308 | 255 | 281 | 213 | 268 | 264 | 266 | 297 | 264 | 253 | 258 | 278 |
| 2009 | 262 | 2,778 | 354 | 2,243 | 275 | 835 | 393 | 418 | 538 | 436 | 522 | 541 |
| 2010 | 503 | 432 | 591 | 2,736 | 834 | 1,015 | 1,047 | 584 | 616 | 627 | 541 | 570 |
| 2011 | 503 | 932 | 2,076 | 552 | 629 | 608 | 1,168 | 4,619 | 699 | 690 | 681 | 682 |
| 2012 | 265 | 242 | 265 | 255 | 250 | 241 | 246 | 572 | 244 | 587 | 592 | 287 |
| 2013 | 294 | 1,468 | 907 | 1,035 | 1,261 | 1,432 | 1,381 | 1,763 | 1,353 | 1,953 | 2,122 | 4,683 |
| 2014 | 2,209 | 3,767 | 3,568 | 3,650 | 3,454 | 3,007 | 5,159 | 3,564 | 2,329 | 4,066 | 3,481 | 3,906 |
| 2015 | 1,837 | 3,014 | 2,995 | 1,164 | 3,302 | 2,650 | 1,468 | 2,417 | 2,510 | 1,984 | 1,864 | 2,074 |
| 2016 | 1,388 | 1,128 | 509 | 2,281 | 1,560 | 1,318 | 811 | 515 | 793 | 845 | 1,377 | 517 |
| 2017 | 1,095 | 1,513 | 174 | 156 | 465 | 459 | 1,044 | 718 | 432 | 1,613 | 1,760 | 2,954 |
| 2018 | 2,790 | 2,607 | 3,261 | 4,723 | 1,997 | 2,588 | 1,829 | 3,170 | 3,839 | 1,678 | 1,100 | 3,584 |
| 2019 | 1,994 | 1,963 | 2,246 | 1,989 | 2,255 | 1,656 | 1,962 | 733 | 2,557 | 2,582 | 2,895 | 1,975 |
| 2020 | 3,548 | 3,382 | 4,141 | 1,284 | 1,573 | 1,339 | 2,293 | 1,319 | 1,946 | 2,673 | 2,200 | 1,915 |
| 2021 | 1,253 | 1,191 | 1,206 | 1,042 | 1,336 | 1,021 | 1,056 | 1,390 | 1,379 | 1,346 | 1,324 | 1,047 |
| 2022 | 1,674 | 1,345 | 2,625 | 2,550 | 2,420 | 1,886 | 1,667 | 1,696 | 1,722 | 2,335 | 2,015 | 2,346 |
| 2023 | 2,347 | 1,385 | 1,764 | 1,744 | 1,444 | 1,701 | 1,103 | 1,461 | 441 | 115 | 1,149 | 1,064 |
| 2024 | 1,073 | |||||||||||
| - = No Data Reported; -- = Not Applicable; NA = Not Available; W = Withheld to avoid disclosure of individual company data. |
| Release Date: 3/29/2024 |
| Next Release Date: 4/30/2024 |