|
Download Data (XLS File) |
|
||||||||
|
||||||||
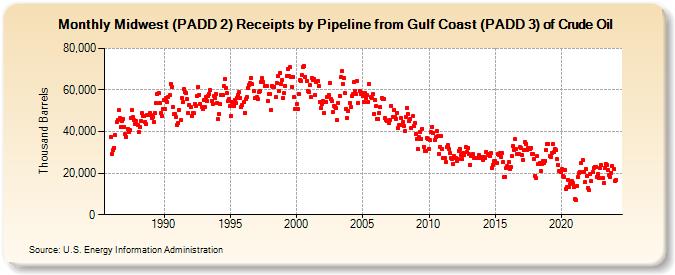
| Midwest (PADD 2) Receipts by Pipeline from Gulf Coast (PADD 3) of Crude Oil (Thousand Barrels) | ||||||||
| Year | Jan | Feb | Mar | Apr | May | Jun | Jul | Aug | Sep | Oct | Nov | Dec |
|---|---|---|---|---|---|---|---|---|---|---|---|---|
| 1986 | 37,405 | 29,399 | 31,104 | 32,275 | 38,265 | 44,500 | 45,515 | 50,135 | 46,492 | 42,388 | 44,855 | 46,084 |
| 1987 | 42,133 | 38,691 | 37,442 | 41,183 | 39,892 | 40,753 | 46,411 | 50,157 | 46,799 | 45,468 | 43,496 | 45,245 |
| 1988 | 43,355 | 39,683 | 42,015 | 45,174 | 48,688 | 47,710 | 47,474 | 44,639 | 43,606 | 48,044 | 48,113 | 48,688 |
| 1989 | 47,771 | 46,338 | 47,229 | 44,546 | 48,744 | 53,510 | 57,835 | 58,659 | 53,797 | 48,779 | 47,282 | 50,978 |
| 1990 | 54,950 | 50,903 | 56,342 | 53,995 | 56,583 | 57,370 | 63,104 | 61,480 | 51,919 | 48,211 | 48,560 | 47,069 |
| 1991 | 43,355 | 44,084 | 50,501 | 45,348 | 56,049 | 54,078 | 60,272 | 58,957 | 58,482 | 55,507 | 49,032 | 52,947 |
| 1992 | 51,619 | 47,589 | 49,005 | 48,707 | 53,428 | 52,399 | 57,095 | 61,563 | 57,806 | 53,425 | 52,026 | 50,794 |
| 1993 | 54,952 | 51,663 | 56,380 | 54,591 | 57,259 | 58,109 | 59,807 | 54,817 | 53,301 | 56,979 | 56,335 | 58,286 |
| 1994 | 53,970 | 45,842 | 48,418 | 53,271 | 57,654 | 57,374 | 61,991 | 65,299 | 60,872 | 58,596 | 54,612 | 55,639 |
| 1995 | 52,462 | 47,362 | 54,191 | 52,322 | 55,415 | 53,632 | 56,061 | 57,751 | 58,815 | 55,935 | 51,636 | 52,945 |
| 1996 | 54,030 | 49,087 | 55,428 | 56,480 | 60,731 | 62,541 | 63,351 | 65,748 | 62,721 | 59,566 | 55,980 | 55,988 |
| 1997 | 56,397 | 55,554 | 59,003 | 59,312 | 63,792 | 65,620 | 63,674 | 61,769 | 61,699 | 61,865 | 54,503 | 57,918 |
| 1998 | 58,118 | 50,502 | 62,015 | 61,529 | 61,551 | 56,548 | 63,447 | 66,497 | 59,504 | 68,338 | 63,062 | 64,576 |
| 1999 | 56,308 | 58,523 | 61,990 | 66,741 | 70,068 | 66,795 | 70,980 | 66,202 | 61,450 | 66,458 | 56,757 | 51,067 |
| 2000 | 53,135 | 50,641 | 58,158 | 64,617 | 64,449 | 67,079 | 71,187 | 71,416 | 66,278 | 64,515 | 59,423 | 58,820 |
| 2001 | 62,214 | 56,495 | 65,996 | 64,595 | 65,206 | 57,478 | 63,828 | 64,111 | 61,966 | 54,351 | 51,126 | 53,077 |
| 2002 | 54,804 | 48,852 | 54,186 | 54,278 | 56,739 | 57,771 | 63,558 | 55,740 | 54,584 | 49,640 | 52,338 | 51,957 |
| 2003 | 51,312 | 45,426 | 53,949 | 57,128 | 66,095 | 68,885 | 62,784 | 65,693 | 58,403 | 51,049 | 46,709 | 49,951 |
| 2004 | 53,962 | 51,791 | 56,926 | 57,981 | 63,652 | 59,317 | 57,889 | 64,088 | 53,860 | 59,684 | 58,068 | 58,563 |
| 2005 | 56,982 | 54,316 | 58,472 | 56,080 | 57,405 | 54,271 | 62,946 | 56,441 | 56,098 | 57,857 | 48,452 | 55,064 |
| 2006 | 52,187 | 46,163 | 45,854 | 49,078 | 51,772 | 56,134 | 55,460 | 55,596 | 46,306 | 45,399 | 44,887 | 45,228 |
| 2007 | 44,017 | 45,697 | 52,311 | 46,936 | 50,280 | 47,212 | 46,187 | 48,975 | 41,545 | 43,214 | 43,019 | 46,563 |
| 2008 | 44,402 | 42,812 | 40,219 | 47,027 | 51,546 | 48,462 | 45,031 | 45,953 | 41,702 | 47,258 | 42,725 | 44,280 |
| 2009 | 38,766 | 36,483 | 31,485 | 37,362 | 39,775 | 36,647 | 41,350 | 32,749 | 30,808 | 30,824 | 36,854 | 36,332 |
| 2010 | 31,768 | 35,810 | 39,578 | 42,230 | 39,354 | 35,940 | 37,240 | 40,262 | 37,730 | 29,367 | 32,799 | 37,746 |
| 2011 | 31,732 | 27,485 | 27,347 | 25,245 | 32,330 | 33,343 | 31,481 | 29,595 | 27,186 | 26,803 | 24,548 | 28,102 |
| 2012 | 27,489 | 25,769 | 26,768 | 30,638 | 31,525 | 28,624 | 26,560 | 29,751 | 28,883 | 32,487 | 30,328 | 32,198 |
| 2013 | 29,067 | 24,084 | 28,417 | 28,470 | 29,158 | 27,273 | 27,332 | 27,435 | 27,261 | 28,560 | 27,056 | 27,840 |
| 2014 | 27,687 | 26,395 | 27,890 | 27,264 | 30,195 | 29,311 | 28,520 | 28,072 | 29,516 | 22,704 | 24,060 | 25,931 |
| 2015 | 25,619 | 24,663 | 29,010 | 28,925 | 29,444 | 27,769 | 29,881 | 25,161 | 18,323 | 18,310 | 22,330 | 23,472 |
| 2016 | 25,143 | 22,135 | 23,092 | 28,218 | 32,952 | 31,279 | 36,190 | 31,373 | 29,299 | 29,218 | 32,419 | 32,239 |
| 2017 | 28,862 | 26,544 | 30,963 | 34,762 | 34,136 | 31,344 | 32,290 | 31,699 | 32,264 | 29,257 | 29,327 | 26,649 |
| 2018 | 18,661 | 17,484 | 28,230 | 24,473 | 24,816 | 20,975 | 24,170 | 25,909 | 24,832 | 25,832 | 31,211 | 34,132 |
| 2019 | 34,215 | 28,205 | 27,650 | 29,793 | 33,950 | 29,974 | 31,774 | 31,006 | 26,611 | 24,072 | 20,824 | 20,354 |
| 2020 | 21,793 | 18,653 | 18,049 | 21,570 | 12,267 | 13,281 | 16,709 | 13,549 | 14,991 | 16,217 | 15,023 | 13,235 |
| 2021 | 7,517 | 6,871 | 13,728 | 18,123 | 19,979 | 20,626 | 24,685 | 26,243 | 20,733 | 15,528 | 21,999 | 18,727 |
| 2022 | 12,832 | 11,660 | 19,766 | 16,040 | 20,458 | 22,612 | 22,997 | 23,144 | 18,313 | 19,620 | 17,675 | 22,298 |
| 2023 | 23,899 | 17,833 | 15,169 | 22,701 | 24,606 | 23,932 | 21,546 | 19,074 | 18,039 | 20,230 | 23,463 | 22,099 |
| 2024 | 16,200 | |||||||||||
| - = No Data Reported; -- = Not Applicable; NA = Not Available; W = Withheld to avoid disclosure of individual company data. |
| Release Date: 3/29/2024 |
| Next Release Date: 4/30/2024 |