|
Download Data (XLS File) |
|
||||||||
|
||||||||
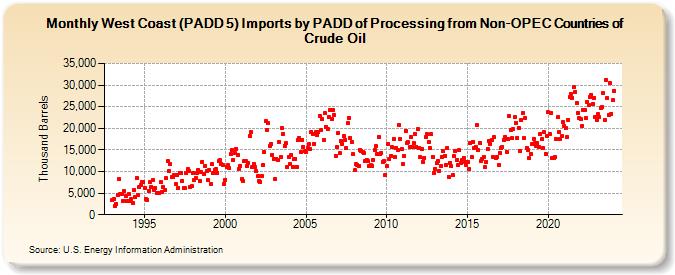
| West Coast (PADD 5) Imports by PADD of Processing from Non-OPEC Countries of Crude Oil (Thousand Barrels) | ||||||||
| Year | Jan | Feb | Mar | Apr | May | Jun | Jul | Aug | Sep | Oct | Nov | Dec |
|---|---|---|---|---|---|---|---|---|---|---|---|---|
| 1993 | 3,502 | 3,661 | 2,024 | 2,520 | 4,668 | 8,240 | 4,760 | 4,734 | 3,271 | 5,392 | 4,385 | 3,200 |
| 1994 | 4,741 | 3,211 | 3,594 | 2,735 | 5,706 | 4,174 | 8,548 | 4,448 | 6,359 | 6,855 | 7,490 | 7,511 |
| 1995 | 6,242 | 3,714 | 3,414 | 5,491 | 7,683 | 6,496 | 8,030 | 5,788 | 6,213 | 5,114 | 5,051 | 5,035 |
| 1996 | 7,562 | 5,332 | 6,401 | 5,833 | 8,410 | 12,356 | 10,080 | 11,631 | 8,839 | 8,682 | 9,134 | 7,151 |
| 1997 | 9,132 | 6,277 | 9,550 | 9,613 | 7,906 | 6,182 | 6,133 | 9,600 | 10,484 | 10,012 | 6,529 | 6,629 |
| 1998 | 9,618 | 8,141 | 8,462 | 9,748 | 10,355 | 7,890 | 9,826 | 12,288 | 9,354 | 11,300 | 10,224 | 8,017 |
| 1999 | 10,338 | 7,176 | 11,632 | 9,762 | 10,431 | 10,637 | 9,769 | 12,469 | 12,550 | 11,836 | 11,610 | 7,182 |
| 2000 | 8,101 | 11,145 | 11,438 | 10,718 | 14,074 | 14,928 | 12,623 | 14,176 | 15,259 | 13,918 | 10,533 | 11,308 |
| 2001 | 8,200 | 7,742 | 12,337 | 12,422 | 11,265 | 12,041 | 18,256 | 19,159 | 10,961 | 11,773 | 10,950 | 10,072 |
| 2002 | 8,938 | 7,773 | 7,663 | 9,061 | 11,420 | 14,425 | 21,621 | 19,569 | 21,219 | 15,941 | 16,457 | 13,921 |
| 2003 | 12,952 | 8,372 | 12,925 | 12,680 | 16,838 | 13,328 | 20,097 | 18,740 | 15,935 | 16,483 | 11,004 | 13,381 |
| 2004 | 11,688 | 13,711 | 10,988 | 12,853 | 13,004 | 11,119 | 17,250 | 17,802 | 14,542 | 17,292 | 15,778 | 14,683 |
| 2005 | 14,476 | 15,504 | 16,275 | 15,194 | 19,172 | 18,735 | 16,471 | 19,065 | 18,415 | 19,170 | 22,842 | 19,492 |
| 2006 | 22,050 | 17,177 | 23,464 | 20,329 | 19,772 | 22,533 | 24,173 | 22,267 | 24,219 | 23,087 | 13,635 | 15,640 |
| 2007 | 19,018 | 14,221 | 17,073 | 16,417 | 18,271 | 17,370 | 15,427 | 21,164 | 22,335 | 17,751 | 16,925 | 14,002 |
| 2008 | 10,273 | 11,664 | 11,530 | 11,274 | 15,026 | 14,844 | 14,422 | 14,359 | 12,391 | 12,632 | 12,336 | 11,340 |
| 2009 | 11,470 | 11,337 | 12,696 | 14,870 | 15,794 | 13,957 | 17,984 | 14,073 | 14,328 | 12,240 | 12,473 | 9,146 |
| 2010 | 11,210 | 16,413 | 12,943 | 13,604 | 15,593 | 17,577 | 13,321 | 15,527 | 15,064 | 20,707 | 17,540 | 15,288 |
| 2011 | 11,659 | 13,497 | 19,476 | 16,697 | 16,818 | 15,655 | 17,983 | 15,765 | 16,508 | 18,774 | 15,692 | 19,741 |
| 2012 | 15,403 | 13,261 | 15,120 | 12,232 | 13,237 | 17,962 | 18,572 | 16,838 | 15,401 | 18,573 | 13,433 | 9,684 |
| 2013 | 10,674 | 11,899 | 12,449 | 10,223 | 11,244 | 13,433 | 14,743 | 13,654 | 11,532 | 15,490 | 8,843 | 12,082 |
| 2014 | 11,193 | 9,232 | 13,516 | 14,743 | 12,547 | 11,439 | 14,878 | 11,984 | 12,735 | 13,209 | 12,261 | 11,592 |
| 2015 | 12,146 | 10,558 | 16,675 | 13,434 | 16,876 | 15,359 | 15,706 | 20,660 | 14,880 | 16,704 | 12,402 | 12,968 |
| 2016 | 13,414 | 11,021 | 12,276 | 15,292 | 17,093 | 16,357 | 17,285 | 13,350 | 17,920 | 13,105 | 13,439 | 11,509 |
| 2017 | 14,395 | 15,501 | 15,684 | 17,376 | 18,006 | 14,614 | 17,489 | 22,826 | 19,569 | 17,659 | 19,867 | 22,516 |
| 2018 | 21,261 | 17,826 | 20,176 | 14,752 | 21,919 | 23,473 | 17,660 | 22,430 | 15,527 | 15,016 | 13,058 | 14,001 |
| 2019 | 16,275 | 17,622 | 16,596 | 15,885 | 16,554 | 15,729 | 18,779 | 17,443 | 15,480 | 19,066 | 14,159 | 18,229 |
| 2020 | 23,743 | 18,632 | 23,638 | 13,206 | 13,220 | 13,451 | 17,488 | 22,537 | 19,154 | 17,638 | 18,179 | 21,405 |
| 2021 | 20,491 | 20,029 | 17,984 | 22,020 | 27,228 | 28,045 | 27,054 | 29,451 | 28,401 | 25,862 | 23,611 | 22,423 |
| 2022 | 22,076 | 20,618 | 24,306 | 24,264 | 22,333 | 26,069 | 25,290 | 27,280 | 27,781 | 25,646 | 27,069 | 22,662 |
| 2023 | 21,910 | 23,197 | 22,526 | 24,795 | 24,929 | 28,085 | 21,991 | 31,206 | 26,991 | 23,085 | 30,387 | 23,423 |
| 2024 | 26,538 | |||||||||||
| - = No Data Reported; -- = Not Applicable; NA = Not Available; W = Withheld to avoid disclosure of individual company data. |
| Release Date: 3/29/2024 |
| Next Release Date: 4/30/2024 |