|
Download Data (XLS File) |
|
||||||||
|
||||||||
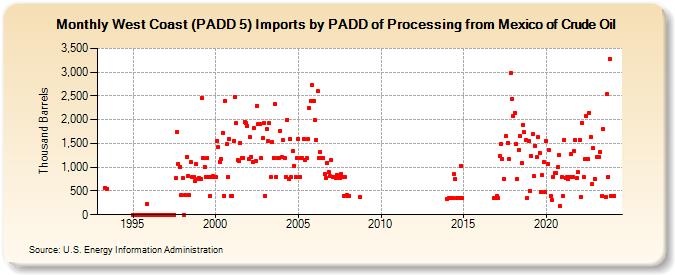
| West Coast (PADD 5) Imports by PADD of Processing from Mexico of Crude Oil (Thousand Barrels) | ||||||||
| Year | Jan | Feb | Mar | Apr | May | Jun | Jul | Aug | Sep | Oct | Nov | Dec |
|---|---|---|---|---|---|---|---|---|---|---|---|---|
| 1993 | 567 | 551 | ||||||||||
| 1995 | 0 | 0 | 0 | 0 | 0 | 0 | 0 | 0 | 0 | 0 | 228 | 0 |
| 1996 | 0 | 0 | 0 | 0 | 0 | 0 | 0 | 0 | 0 | 0 | 0 | 0 |
| 1997 | 0 | 0 | 0 | 0 | 0 | 0 | 0 | 769 | 1,742 | 1,072 | 1,011 | 410 |
| 1998 | 767 | 0 | 422 | 1,221 | 822 | 410 | 1,103 | 785 | 800 | 700 | 1,059 | 746 |
| 1999 | 778 | 747 | 2,464 | 1,201 | 999 | 800 | 1,200 | 801 | 400 | 795 | 811 | 799 |
| 2000 | 800 | 1,560 | 1,415 | 1,112 | 1,178 | 1,723 | 400 | 2,392 | 1,479 | 801 | 1,597 | 401 |
| 2001 | 400 | 1,547 | 2,482 | 1,928 | 1,144 | 1,130 | 1,508 | 1,196 | 1,202 | 1,951 | 1,928 | 1,872 |
| 2002 | 1,164 | 1,629 | 1,221 | 1,115 | 1,823 | 1,131 | 2,296 | 1,916 | 1,902 | 1,200 | 1,604 | 1,932 |
| 2003 | 400 | 1,798 | 1,545 | 1,927 | 798 | 1,532 | 1,196 | 2,321 | 797 | 1,193 | 1,197 | 1,765 |
| 2004 | 1,204 | 1,564 | 1,202 | 802 | 2,002 | 762 | 1,590 | 793 | 1,334 | 1,034 | 799 | 1,198 |
| 2005 | 1,597 | 799 | 1,201 | 1,198 | 1,592 | 1,158 | 1,184 | 1,583 | 2,246 | 2,388 | 2,732 | 2,397 |
| 2006 | 1,987 | 1,572 | 2,595 | 1,201 | 1,310 | 1,195 | 1,197 | 847 | 775 | 1,093 | 895 | 806 |
| 2007 | 1,147 | 796 | 804 | 780 | 842 | 799 | 781 | 862 | 785 | 400 | 798 | 420 |
| 2008 | 401 | 400 | 374 | |||||||||
| 2014 | 339 | 346 | 350 | 359 | 357 | 848 | 748 | 349 | 360 | 1,027 | 358 | |
| 2016 | 351 | 349 | ||||||||||
| 2017 | 400 | 350 | 1,240 | 1,493 | 1,176 | 753 | 1,654 | 1,508 | 1,166 | 2,982 | 2,438 | |
| 2018 | 2,072 | 2,147 | 1,496 | 756 | 1,368 | 1,657 | 1,083 | 1,890 | 1,732 | 1,576 | 360 | 1,551 |
| 2019 | 507 | 1,230 | 1,689 | 805 | 1,455 | 1,223 | 1,625 | 1,307 | 477 | 830 | 1,109 | 479 |
| 2020 | 1,549 | 1,076 | 1,353 | 404 | 313 | 799 | 881 | 880 | 998 | 1,248 | 173 | 794 |
| 2021 | 397 | 1,569 | 780 | 789 | 749 | 797 | 1,273 | 795 | 1,334 | 1,569 | 775 | 897 |
| 2022 | 1,579 | 375 | 1,934 | 803 | 1,168 | 2,074 | 1,172 | 2,147 | 1,645 | 640 | 1,403 | 760 |
| 2023 | 1,208 | 1,209 | 1,310 | 399 | 1,796 | 381 | 2,536 | 799 | 3,282 | 395 | ||
| - = No Data Reported; -- = Not Applicable; NA = Not Available; W = Withheld to avoid disclosure of individual company data. |
| Release Date: 3/29/2024 |
| Next Release Date: 4/30/2024 |