|
Download Data (XLS File) |
|
||||||||
|
||||||||
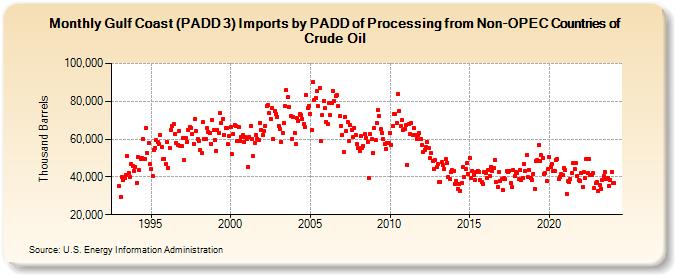
| Gulf Coast (PADD 3) Imports by PADD of Processing from Non-OPEC Countries of Crude Oil (Thousand Barrels) | ||||||||
| Year | Jan | Feb | Mar | Apr | May | Jun | Jul | Aug | Sep | Oct | Nov | Dec |
|---|---|---|---|---|---|---|---|---|---|---|---|---|
| 1993 | 35,175 | 29,203 | 40,197 | 38,221 | 39,349 | 40,961 | 50,801 | 42,285 | 39,808 | 46,755 | 45,880 | 43,186 |
| 1994 | 45,350 | 36,843 | 50,527 | 43,498 | 49,656 | 50,098 | 59,923 | 49,424 | 66,003 | 52,657 | 58,149 | 46,738 |
| 1995 | 44,180 | 40,432 | 54,441 | 55,552 | 59,382 | 58,258 | 57,290 | 61,952 | 55,755 | 49,300 | 49,479 | 46,962 |
| 1996 | 58,241 | 44,627 | 55,202 | 64,763 | 66,854 | 68,042 | 62,825 | 57,899 | 56,932 | 64,375 | 56,602 | 56,365 |
| 1997 | 60,576 | 48,909 | 60,424 | 58,695 | 64,763 | 66,336 | 65,955 | 62,599 | 57,442 | 70,398 | 64,214 | 60,118 |
| 1998 | 58,757 | 54,231 | 52,581 | 68,803 | 60,210 | 60,290 | 65,863 | 63,896 | 63,071 | 57,578 | 70,274 | 64,556 |
| 1999 | 59,686 | 53,859 | 64,853 | 63,434 | 73,778 | 68,632 | 70,541 | 62,239 | 65,657 | 65,727 | 57,194 | 61,738 |
| 2000 | 66,650 | 51,934 | 62,754 | 67,369 | 66,691 | 58,908 | 66,336 | 59,241 | 60,878 | 61,918 | 58,371 | 60,860 |
| 2001 | 60,067 | 45,288 | 61,274 | 67,176 | 60,071 | 50,856 | 58,170 | 62,319 | 60,249 | 59,355 | 68,765 | 64,958 |
| 2002 | 62,003 | 64,171 | 66,983 | 77,464 | 78,009 | 73,734 | 70,689 | 76,229 | 59,955 | 74,899 | 73,343 | 71,767 |
| 2003 | 67,096 | 65,585 | 58,526 | 63,098 | 68,558 | 77,288 | 85,867 | 82,122 | 77,169 | 72,189 | 60,024 | 71,564 |
| 2004 | 63,484 | 57,305 | 70,930 | 69,673 | 73,172 | 72,738 | 70,524 | 67,928 | 66,375 | 83,197 | 76,413 | 77,488 |
| 2005 | 73,451 | 64,930 | 89,950 | 80,759 | 81,913 | 85,540 | 77,256 | 87,168 | 58,754 | 72,555 | 80,292 | 76,423 |
| 2006 | 69,091 | 67,844 | 79,348 | 72,657 | 79,083 | 85,680 | 80,297 | 82,572 | 83,103 | 77,254 | 71,960 | 66,947 |
| 2007 | 62,337 | 53,439 | 71,899 | 64,033 | 68,971 | 59,167 | 67,348 | 65,003 | 61,081 | 66,097 | 61,909 | 57,503 |
| 2008 | 55,290 | 53,930 | 61,592 | 55,429 | 56,402 | 62,528 | 60,699 | 58,594 | 39,364 | 62,662 | 59,833 | 52,481 |
| 2009 | 65,688 | 59,272 | 68,562 | 75,431 | 72,174 | 65,097 | 63,480 | 60,075 | 57,453 | 54,952 | 57,913 | 57,858 |
| 2010 | 63,377 | 57,011 | 66,730 | 73,504 | 73,369 | 68,347 | 83,829 | 74,970 | 66,755 | 70,253 | 64,914 | 65,082 |
| 2011 | 67,297 | 46,540 | 67,745 | 62,456 | 68,553 | 62,181 | 65,693 | 61,909 | 60,261 | 62,343 | 63,096 | 59,830 |
| 2012 | 56,818 | 53,230 | 54,043 | 56,049 | 58,330 | 55,510 | 49,977 | 52,430 | 48,172 | 44,170 | 48,878 | 45,182 |
| 2013 | 46,750 | 37,178 | 37,462 | 47,714 | 46,195 | 44,094 | 49,208 | 47,475 | 40,046 | 38,798 | 42,427 | 43,592 |
| 2014 | 43,360 | 36,350 | 38,076 | 33,826 | 36,357 | 32,665 | 36,750 | 45,286 | 39,838 | 44,124 | 47,561 | 41,747 |
| 2015 | 50,230 | 39,669 | 43,346 | 41,242 | 38,194 | 42,583 | 43,380 | 42,811 | 38,430 | 37,310 | 36,156 | 42,474 |
| 2016 | 42,244 | 39,613 | 43,434 | 40,395 | 45,398 | 43,370 | 44,602 | 49,053 | 37,207 | 34,866 | 42,456 | 37,645 |
| 2017 | 38,862 | 33,227 | 39,238 | 38,648 | 42,915 | 42,434 | 43,284 | 36,694 | 34,487 | 43,624 | 40,344 | 42,610 |
| 2018 | 42,075 | 38,836 | 43,657 | 38,519 | 39,299 | 46,705 | 43,030 | 51,397 | 39,713 | 43,675 | 39,217 | 38,226 |
| 2019 | 41,780 | 33,647 | 48,402 | 48,782 | 56,694 | 48,332 | 51,379 | 49,812 | 41,437 | 41,979 | 37,618 | 43,949 |
| 2020 | 50,520 | 45,460 | 46,958 | 42,863 | 43,130 | 49,058 | 49,298 | 38,802 | 39,857 | 41,285 | 40,961 | 44,583 |
| 2021 | 43,826 | 31,094 | 37,586 | 37,159 | 39,071 | 42,145 | 47,154 | 44,269 | 47,239 | 40,449 | 38,172 | 37,913 |
| 2022 | 41,900 | 34,858 | 42,510 | 39,182 | 49,608 | 42,099 | 49,486 | 40,819 | 40,909 | 42,051 | 33,986 | 36,625 |
| 2023 | 37,344 | 32,538 | 35,465 | 33,829 | 38,579 | 40,323 | 42,722 | 39,136 | 39,520 | 35,403 | 38,324 | 42,582 |
| 2024 | 36,960 | |||||||||||
| - = No Data Reported; -- = Not Applicable; NA = Not Available; W = Withheld to avoid disclosure of individual company data. |
| Release Date: 3/29/2024 |
| Next Release Date: 4/30/2024 |