|
Download Data (XLS File) |
|
||||||||
|
||||||||
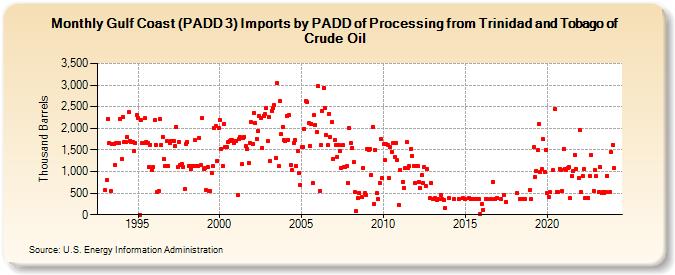
| Gulf Coast (PADD 3) Imports by PADD of Processing from Trinidad and Tobago of Crude Oil (Thousand Barrels) | ||||||||
| Year | Jan | Feb | Mar | Apr | May | Jun | Jul | Aug | Sep | Oct | Nov | Dec |
|---|---|---|---|---|---|---|---|---|---|---|---|---|
| 1993 | 564 | 802 | 2,213 | 1,658 | 545 | 1,641 | 1,632 | 1,153 | 1,659 | 1,670 | 1,655 | 2,214 |
| 1994 | 1,292 | 2,250 | 1,679 | 1,680 | 1,796 | 2,369 | 1,712 | 1,691 | 1,678 | 1,468 | 1,658 | 2,300 |
| 1995 | 2,235 | 0 | 2,185 | 1,662 | 1,653 | 2,227 | 1,689 | 1,649 | 1,112 | 1,620 | 1,041 | 1,110 |
| 1996 | 2,189 | 1,620 | 517 | 540 | 2,211 | 1,615 | 1,810 | 1,295 | 1,123 | 1,709 | 1,125 | 1,669 |
| 1997 | 1,713 | 1,710 | 1,698 | 1,579 | 2,035 | 1,095 | 1,686 | 1,142 | 1,180 | 1,114 | 584 | 1,642 |
| 1998 | 1,681 | 1,137 | 1,123 | 1,067 | 1,137 | 1,136 | 1,721 | 1,129 | 1,135 | 1,781 | 1,139 | 2,239 |
| 1999 | 1,068 | 1,073 | 564 | 1,101 | 551 | 545 | 975 | 1,118 | 2,000 | 2,042 | 1,253 | 1,999 |
| 2000 | 2,197 | 1,521 | 1,132 | 2,110 | 1,570 | 1,573 | 1,679 | 1,713 | 1,727 | 1,727 | 1,667 | 1,715 |
| 2001 | 1,711 | 449 | 1,758 | 1,798 | 1,166 | 1,766 | 1,809 | 1,588 | 1,518 | 1,195 | 1,666 | 2,138 |
| 2002 | 1,639 | 2,360 | 2,115 | 1,760 | 1,938 | 2,289 | 2,238 | 1,545 | 2,290 | 2,320 | 2,466 | 1,703 |
| 2003 | 2,261 | 1,245 | 2,405 | 2,471 | 2,532 | 1,312 | 3,040 | 1,117 | 2,623 | 1,864 | 2,037 | 1,722 |
| 2004 | 1,713 | 2,296 | 1,738 | 2,307 | 1,159 | 1,029 | 1,666 | 1,736 | 1,126 | 1,486 | 969 | 692 |
| 2005 | 1,558 | 1,556 | 1,990 | 2,623 | 2,601 | 2,111 | 1,599 | 2,101 | 739 | 2,302 | 2,087 | 1,925 |
| 2006 | 2,974 | 550 | 1,611 | 2,407 | 2,935 | 2,473 | 1,841 | 1,606 | 2,342 | 1,798 | 2,137 | 1,296 |
| 2007 | 1,725 | 1,615 | 1,340 | 1,611 | 1,473 | 1,082 | 1,608 | 1,102 | 1,110 | 1,134 | 742 | 2,006 |
| 2008 | 1,660 | 1,545 | 1,220 | 524 | 76 | 376 | 510 | 404 | 1,080 | 498 | 462 | |
| 2009 | 1,532 | 1,507 | 1,511 | 916 | 2,027 | 250 | 1,499 | 501 | 360 | 737 | 1,742 | 839 |
| 2010 | 1,627 | 1,259 | 1,627 | 1,620 | 839 | 1,567 | 1,455 | 1,655 | 1,338 | 1,657 | 1,256 | 223 |
| 2011 | 1,035 | 758 | 619 | 1,075 | 1,680 | 1,077 | 1,121 | 1,516 | 1,359 | 1,136 | 739 | |
| 2012 | 1,119 | 1,118 | 759 | 608 | 910 | 738 | 1,100 | 654 | 1,057 | 380 | 739 | |
| 2013 | 361 | 380 | 342 | 359 | 460 | 374 | 348 | 151 | ||||
| 2014 | 381 | 361 | 361 | 377 | ||||||||
| 2015 | 361 | 376 | 360 | 361 | 360 | 360 | 353 | 6 | ||||
| 2016 | 240 | 120 | 365 | 360 | 360 | 759 | 361 | 380 | ||||
| 2017 | 362 | 450 | 300 | |||||||||
| 2018 | 499 | 360 | 360 | 360 | 576 | |||||||
| 2019 | 360 | 1,558 | 875 | 1,021 | 1,495 | 2,095 | 998 | 1,050 | 1,750 | 995 | 1,505 | |
| 2020 | 498 | 421 | 525 | 1,025 | 2,445 | 526 | 523 | 1,065 | 1,037 | 546 | ||
| 2021 | 1,527 | 1,063 | 1,029 | 1,091 | 1,099 | 379 | 898 | 1,021 | 1,393 | 1,060 | 861 | |
| 2022 | 1,949 | 525 | 900 | 1,059 | 379 | 391 | 903 | 1,387 | 549 | 1,034 | ||
| 2023 | 891 | 525 | 1,096 | 500 | 525 | 508 | 524 | 900 | 523 | 1,451 | ||
| 2024 | 1,624 | |||||||||||
| - = No Data Reported; -- = Not Applicable; NA = Not Available; W = Withheld to avoid disclosure of individual company data. |
| Release Date: 3/29/2024 |
| Next Release Date: 4/30/2024 |