|
Download Data (XLS File) |
|
||||||||
|
||||||||
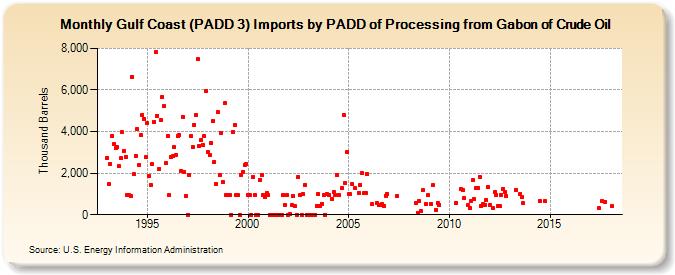
| Gulf Coast (PADD 3) Imports by PADD of Processing from Gabon of Crude Oil (Thousand Barrels) | ||||||||
| Year | Jan | Feb | Mar | Apr | May | Jun | Jul | Aug | Sep | Oct | Nov | Dec |
|---|---|---|---|---|---|---|---|---|---|---|---|---|
| 1993 | 2,744 | 1,471 | 2,452 | 3,802 | 3,400 | 3,199 | 3,237 | 2,321 | 2,715 | 3,956 | 3,075 | 2,782 |
| 1994 | 925 | 925 | 921 | 6,641 | 1,935 | 2,839 | 4,111 | 2,398 | 3,837 | 4,801 | 4,617 | 2,764 |
| 1995 | 4,405 | 1,876 | 1,444 | 2,428 | 4,463 | 7,809 | 4,760 | 2,219 | 4,557 | 5,663 | 5,214 | 2,498 |
| 1996 | 3,797 | 928 | 2,789 | 2,805 | 3,255 | 2,887 | 3,768 | 3,828 | 2,123 | 4,700 | 2,050 | 924 |
| 1997 | 0 | 1,924 | 3,796 | 3,246 | 4,329 | 4,802 | 7,477 | 3,323 | 3,581 | 3,372 | 3,764 | 5,945 |
| 1998 | 3,025 | 2,865 | 3,445 | 4,509 | 2,559 | 1,481 | 4,938 | 1,896 | 3,953 | 1,569 | 5,352 | 949 |
| 1999 | 947 | 947 | 0 | 3,972 | 4,316 | 947 | 948 | 0 | 1,899 | 2,071 | 2,397 | 2,450 |
| 2000 | 949 | 947 | 0 | 1,830 | 949 | 0 | 0 | 1,671 | 1,901 | 947 | 849 | 1,044 |
| 2001 | 950 | 0 | 0 | 0 | 0 | 0 | 0 | 0 | 0 | 945 | 475 | 947 |
| 2002 | 0 | 35 | 468 | 911 | 397 | 0 | 1,817 | 937 | 0 | 995 | 1,447 | 0 |
| 2003 | 0 | 0 | 0 | 0 | 0 | 433 | 994 | 441 | 534 | 941 | 0 | 995 |
| 2004 | 958 | 777 | 1,081 | 966 | 1,911 | 966 | 1,287 | 4,801 | 1,508 | 3,020 | ||
| 2005 | 974 | 973 | 1,498 | 1,271 | 1,059 | 1,446 | 1,983 | 1,043 | 1,055 | 1,958 | ||
| 2006 | 499 | 549 | 476 | 454 | 505 | 430 | 919 | 1,004 | ||||
| 2007 | 900 | |||||||||||
| 2008 | 563 | 104 | 650 | 166 | 1,165 | 500 | 925 | |||||
| 2009 | 522 | 1,414 | 230 | 561 | 481 | |||||||
| 2010 | 554 | 1,232 | 1,182 | 795 | 450 | |||||||
| 2011 | 338 | 676 | 1,650 | 748 | 1,293 | 1,306 | 1,827 | 406 | 528 | 451 | 719 | 1,332 |
| 2012 | 476 | 299 | 1,079 | 971 | 398 | 396 | 940 | 1,260 | 1,115 | 891 | ||
| 2013 | 1,184 | 992 | 876 | 545 | ||||||||
| 2014 | 657 | 638 | ||||||||||
| 2017 | 304 | 648 | 629 | |||||||||
| 2018 | 398 | |||||||||||
| - = No Data Reported; -- = Not Applicable; NA = Not Available; W = Withheld to avoid disclosure of individual company data. |
| Release Date: 3/29/2024 |
| Next Release Date: 4/30/2024 |