|
Download Data (XLS File) |
|
||||||||
|
||||||||
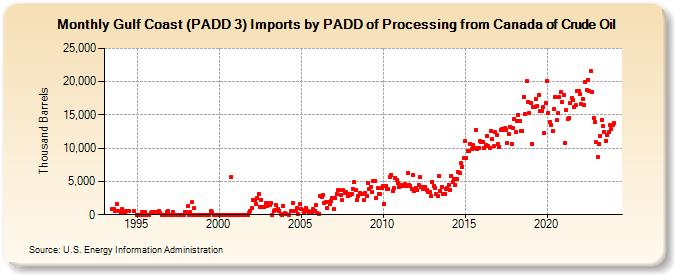
| Gulf Coast (PADD 3) Imports by PADD of Processing from Canada of Crude Oil (Thousand Barrels) | ||||||||
| Year | Jan | Feb | Mar | Apr | May | Jun | Jul | Aug | Sep | Oct | Nov | Dec |
|---|---|---|---|---|---|---|---|---|---|---|---|---|
| 1993 | 925 | 896 | 493 | 1,619 | 495 | |||||||
| 1994 | 251 | 832 | 289 | 258 | 487 | 511 | 489 | 501 | ||||
| 1995 | 0 | 0 | 0 | 0 | 465 | 0 | 466 | 0 | 0 | 0 | 242 | 390 |
| 1996 | 373 | 399 | 317 | 364 | 498 | 287 | 0 | 0 | 0 | 0 | 418 | 495 |
| 1997 | 0 | 0 | 482 | 0 | 0 | 0 | 0 | 0 | 0 | 0 | 0 | 414 |
| 1998 | 386 | 1,297 | 0 | 340 | 1,872 | 0 | 960 | 0 | 0 | 0 | 0 | 0 |
| 1999 | 0 | 0 | 0 | 0 | 0 | 0 | 545 | 370 | 0 | 0 | 0 | 0 |
| 2000 | 0 | 0 | 0 | 0 | 0 | 0 | 0 | 0 | 0 | 5,735 | 0 | 0 |
| 2001 | 0 | 0 | 0 | 0 | 0 | 0 | 0 | 0 | 0 | 0 | 324 | 627 |
| 2002 | 942 | 2,265 | 2,204 | 1,574 | 2,507 | 3,142 | 1,158 | 2,269 | 1,222 | 1,127 | 1,827 | 1,346 |
| 2003 | 1,692 | 1,493 | 1,735 | 0 | 619 | 675 | 1,422 | 917 | 598 | 126 | 0 | 1,324 |
| 2004 | 185 | 169 | 0 | 569 | 1,826 | 579 | 617 | 938 | 120 | 1,628 | ||
| 2005 | 824 | 346 | 717 | 1,002 | 571 | 364 | 366 | 365 | 797 | 528 | 1,531 | |
| 2006 | 185 | 178 | 2,885 | 2,700 | 3,017 | 1,723 | 1,901 | 1,018 | 1,863 | 1,629 | 1,996 | 2,535 |
| 2007 | 802 | 2,512 | 3,098 | 3,762 | 3,641 | 3,020 | 2,187 | 3,667 | 3,192 | 3,412 | 2,742 | 3,083 |
| 2008 | 3,016 | 3,166 | 3,885 | 4,920 | 3,687 | 2,231 | 2,765 | 3,241 | 3,083 | 3,158 | 2,233 | 3,272 |
| 2009 | 2,787 | 4,733 | 3,889 | 4,229 | 3,449 | 5,074 | 5,083 | 2,456 | 4,066 | 3,132 | 3,048 | 3,981 |
| 2010 | 4,316 | 1,677 | 4,289 | 3,898 | 3,850 | 5,660 | 6,041 | 3,514 | 3,969 | 5,539 | 5,164 | 4,780 |
| 2011 | 4,118 | 4,485 | 4,368 | 4,341 | 4,658 | 4,243 | 6,245 | 4,498 | 4,377 | 3,874 | 5,961 | 3,547 |
| 2012 | 4,012 | 3,713 | 4,467 | 5,595 | 4,191 | 3,903 | 4,121 | 4,140 | 3,686 | 3,347 | 3,395 | 2,791 |
| 2013 | 4,885 | 4,330 | 4,088 | 3,047 | 2,845 | 5,863 | 3,587 | 4,207 | 3,120 | 3,120 | 3,823 | 3,962 |
| 2014 | 4,515 | 3,765 | 5,862 | 4,922 | 5,299 | 4,454 | 5,398 | 6,494 | 6,300 | 7,732 | 7,235 | 8,560 |
| 2015 | 11,044 | 8,491 | 9,621 | 9,572 | 10,642 | 9,890 | 10,430 | 9,975 | 12,732 | 9,932 | 10,090 | 11,075 |
| 2016 | 10,935 | 10,957 | 9,958 | 10,458 | 11,889 | 10,296 | 10,100 | 12,627 | 11,393 | 10,283 | 12,390 | 12,038 |
| 2017 | 10,624 | 10,199 | 12,753 | 12,865 | 12,747 | 12,967 | 12,665 | 10,762 | 12,159 | 13,233 | 10,649 | 12,992 |
| 2018 | 14,369 | 12,375 | 14,040 | 15,058 | 14,104 | 12,609 | 12,600 | 17,733 | 15,086 | 20,029 | 17,012 | 15,231 |
| 2019 | 16,843 | 10,682 | 16,198 | 16,122 | 17,437 | 16,406 | 18,057 | 15,654 | 15,603 | 16,147 | 12,330 | 16,730 |
| 2020 | 20,049 | 15,356 | 14,001 | 13,414 | 12,573 | 15,831 | 17,750 | 14,266 | 15,285 | 17,652 | 18,407 | 16,973 |
| 2021 | 17,956 | 10,761 | 15,680 | 14,367 | 14,509 | 16,824 | 17,549 | 17,216 | 16,153 | 16,422 | 18,663 | 18,665 |
| 2022 | 18,175 | 16,666 | 17,431 | 16,531 | 20,005 | 18,737 | 20,254 | 18,657 | 21,531 | 18,404 | 14,590 | 13,889 |
| 2023 | 17,712 | 15,976 | 16,449 | 16,827 | 16,878 | 17,010 | 16,025 | 16,822 | 16,970 | 16,523 | 14,721 | 13,817 |
| 2024 | 13,533 | 13,821 | 12,340 | 12,908 | 15,686 | 13,041 | ||||||
| - = No Data Reported; -- = Not Applicable; NA = Not Available; W = Withheld to avoid disclosure of individual company data. |
| Release Date: 8/30/2024 |
| Next Release Date: 9/30/2024 |