|
Download Data (XLS File) |
|
||||||||
|
||||||||
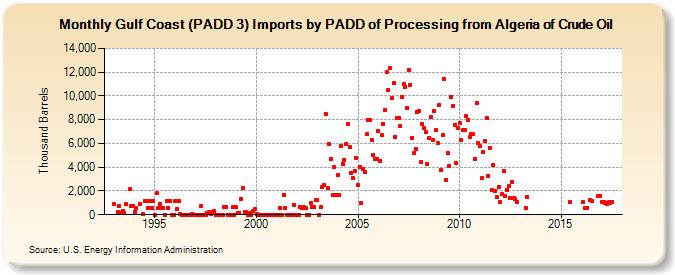
| Gulf Coast (PADD 3) Imports by PADD of Processing from Algeria of Crude Oil (Thousand Barrels) | ||||||||
| Year | Jan | Feb | Mar | Apr | May | Jun | Jul | Aug | Sep | Oct | Nov | Dec |
|---|---|---|---|---|---|---|---|---|---|---|---|---|
| 1993 | 867 | 205 | 771 | 103 | 349 | 179 | 870 | 2,174 | 752 | 772 | ||
| 1994 | 250 | 573 | 885 | 71 | 1,169 | 1,196 | 600 | 1,189 | 585 | 1,196 | ||
| 1995 | 0 | 1,795 | 595 | 942 | 526 | 585 | 0 | 1,170 | 594 | 1,194 | 0 | 0 |
| 1996 | 1,170 | 475 | 1,182 | 58 | 0 | 0 | 0 | 0 | 0 | 0 | 79 | 0 |
| 1997 | 0 | 0 | 0 | 696 | 0 | 0 | 0 | 133 | 190 | 100 | 200 | 271 |
| 1998 | 0 | 0 | 0 | 0 | 0 | 626 | 612 | 0 | 0 | 0 | 669 | 0 |
| 1999 | 614 | 162 | 172 | 1,363 | 2,287 | 202 | 197 | 0 | 126 | 0 | 323 | 466 |
| 2000 | 84 | 0 | 0 | 2 | 0 | 0 | 0 | 0 | 0 | 0 | 0 | 0 |
| 2001 | 0 | 0 | 581 | 0 | 1,673 | 601 | 0 | 0 | 0 | 0 | 797 | 0 |
| 2002 | 0 | 0 | 633 | 582 | 618 | 581 | 0 | 0 | 971 | 628 | 627 | 1,229 |
| 2003 | 1,214 | 0 | 625 | 2,296 | 2,510 | 8,472 | 2,245 | 5,939 | 4,711 | 1,665 | 3,997 | 1,638 |
| 2004 | 3,313 | 1,642 | 5,743 | 4,308 | 4,600 | 5,985 | 7,609 | 5,687 | 3,504 | 3,090 | 3,650 | 4,775 |
| 2005 | 2,490 | 4,002 | 988 | 3,845 | 3,632 | 6,769 | 8,005 | 7,935 | 6,290 | 5,027 | 4,677 | 4,708 |
| 2006 | 7,027 | 4,557 | 6,683 | 7,677 | 8,800 | 11,984 | 10,526 | 12,313 | 9,823 | 11,076 | 6,549 | 8,160 |
| 2007 | 8,152 | 7,458 | 9,924 | 11,024 | 10,758 | 8,974 | 12,203 | 10,929 | 6,486 | 5,164 | 5,516 | 8,613 |
| 2008 | 8,761 | 4,403 | 7,646 | 7,269 | 6,981 | 4,240 | 6,418 | 8,214 | 6,271 | 8,706 | 7,108 | 6,005 |
| 2009 | 9,248 | 3,763 | 6,677 | 11,419 | 2,923 | 5,223 | 4,080 | 9,916 | 9,152 | 7,543 | 4,350 | 7,338 |
| 2010 | 7,687 | 6,302 | 7,121 | 7,162 | 8,349 | 7,986 | 6,544 | 6,823 | 6,777 | 4,720 | 9,424 | 5,997 |
| 2011 | 5,752 | 3,054 | 5,311 | 6,202 | 8,159 | 3,289 | 5,618 | 2,059 | 4,155 | 1,974 | 1,458 | 2,363 |
| 2012 | 1,069 | 1,737 | 3,667 | 1,562 | 2,094 | 2,388 | 1,394 | 2,774 | 1,441 | 1,297 | 1,048 | |
| 2013 | 598 | 1,515 | ||||||||||
| 2015 | 1,060 | |||||||||||
| 2016 | 1,064 | 604 | 599 | 1,253 | 1,191 | 1,581 | 1,577 | |||||
| 2017 | 1,065 | 1,052 | 999 | 897 | 1,056 | 1,000 | 1,064 | |||||
| - = No Data Reported; -- = Not Applicable; NA = Not Available; W = Withheld to avoid disclosure of individual company data. |
| Release Date: 3/29/2024 |
| Next Release Date: 4/30/2024 |