|
Download Data (XLS File) |
|
||||||||
|
||||||||
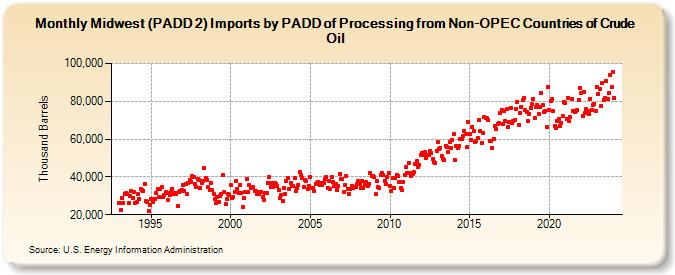
| Midwest (PADD 2) Imports by PADD of Processing from Non-OPEC Countries of Crude Oil (Thousand Barrels) | ||||||||
| Year | Jan | Feb | Mar | Apr | May | Jun | Jul | Aug | Sep | Oct | Nov | Dec |
|---|---|---|---|---|---|---|---|---|---|---|---|---|
| 1993 | 26,210 | 22,371 | 29,053 | 26,396 | 31,166 | 31,368 | 30,771 | 26,382 | 29,963 | 32,779 | 28,898 | 31,779 |
| 1994 | 26,417 | 26,556 | 30,920 | 28,254 | 33,493 | 33,172 | 32,664 | 36,470 | 27,147 | 26,806 | 21,940 | 25,335 |
| 1995 | 28,439 | 26,740 | 28,180 | 28,507 | 31,480 | 33,458 | 29,139 | 33,490 | 34,732 | 29,461 | 30,230 | 31,783 |
| 1996 | 31,282 | 27,899 | 30,233 | 31,914 | 33,559 | 30,864 | 31,373 | 31,173 | 24,614 | 31,795 | 32,517 | 33,311 |
| 1997 | 35,777 | 32,620 | 36,064 | 30,856 | 37,039 | 38,150 | 37,508 | 40,240 | 40,001 | 36,082 | 34,614 | 38,706 |
| 1998 | 38,160 | 34,226 | 36,656 | 37,871 | 44,556 | 39,393 | 38,516 | 34,554 | 32,876 | 36,750 | 32,929 | 31,105 |
| 1999 | 28,209 | 26,303 | 29,448 | 26,786 | 30,142 | 30,834 | 40,919 | 32,119 | 25,441 | 28,423 | 31,011 | 30,497 |
| 2000 | 35,597 | 28,899 | 29,572 | 32,094 | 37,727 | 33,651 | 31,654 | 35,785 | 31,509 | 23,953 | 28,860 | 32,080 |
| 2001 | 38,653 | 31,897 | 35,499 | 34,171 | 34,439 | 34,716 | 32,773 | 32,646 | 31,117 | 30,870 | 32,230 | 32,191 |
| 2002 | 29,328 | 28,047 | 31,723 | 31,386 | 36,961 | 40,112 | 34,618 | 36,697 | 34,658 | 36,798 | 36,310 | 35,417 |
| 2003 | 33,315 | 28,611 | 30,396 | 27,153 | 34,311 | 30,954 | 38,070 | 39,504 | 33,748 | 36,715 | 35,315 | 35,060 |
| 2004 | 39,164 | 32,517 | 33,883 | 35,801 | 42,659 | 41,208 | 39,355 | 34,864 | 38,363 | 37,769 | 33,570 | 35,430 |
| 2005 | 39,938 | 34,218 | 34,237 | 32,418 | 36,385 | 36,970 | 37,225 | 35,498 | 36,999 | 35,776 | 37,039 | 38,705 |
| 2006 | 39,916 | 34,282 | 37,725 | 33,519 | 40,144 | 37,163 | 35,194 | 36,207 | 33,214 | 35,315 | 41,475 | 38,779 |
| 2007 | 38,787 | 31,764 | 35,524 | 40,626 | 33,773 | 31,174 | 33,587 | 35,204 | 34,219 | 34,801 | 34,655 | 36,255 |
| 2008 | 37,622 | 36,190 | 33,968 | 37,627 | 34,161 | 35,702 | 37,317 | 34,930 | 36,056 | 41,996 | 40,642 | 40,358 |
| 2009 | 39,840 | 30,950 | 37,765 | 34,862 | 34,025 | 41,089 | 42,264 | 40,781 | 37,881 | 36,135 | 39,715 | 42,182 |
| 2010 | 35,228 | 32,399 | 39,327 | 34,379 | 39,441 | 41,110 | 40,359 | 37,393 | 33,990 | 33,302 | 37,115 | 41,116 |
| 2011 | 45,484 | 42,027 | 47,454 | 41,977 | 40,634 | 41,678 | 42,457 | 46,685 | 48,262 | 45,387 | 46,528 | 51,686 |
| 2012 | 52,702 | 51,692 | 53,077 | 49,943 | 51,812 | 51,566 | 53,634 | 52,687 | 49,251 | 47,640 | 47,464 | 53,816 |
| 2013 | 58,213 | 54,735 | 55,300 | 51,166 | 49,492 | 48,839 | 56,484 | 55,809 | 52,928 | 58,463 | 55,507 | 59,386 |
| 2014 | 62,445 | 49,003 | 56,283 | 55,292 | 56,264 | 60,057 | 60,231 | 61,424 | 64,343 | 62,861 | 55,587 | 68,815 |
| 2015 | 62,799 | 59,571 | 66,198 | 64,336 | 58,559 | 59,122 | 60,673 | 69,986 | 64,282 | 58,056 | 63,306 | 71,459 |
| 2016 | 71,037 | 71,089 | 70,207 | 59,046 | 59,161 | 55,486 | 60,155 | 67,124 | 65,356 | 67,891 | 68,616 | 73,811 |
| 2017 | 75,600 | 67,965 | 74,891 | 69,433 | 75,853 | 66,649 | 69,017 | 76,550 | 68,547 | 69,409 | 70,167 | 75,897 |
| 2018 | 79,678 | 67,442 | 73,844 | 77,220 | 80,448 | 81,786 | 75,358 | 74,258 | 69,417 | 73,376 | 76,646 | 78,365 |
| 2019 | 81,378 | 71,419 | 76,894 | 77,927 | 73,407 | 76,808 | 84,378 | 77,976 | 74,273 | 74,821 | 66,343 | 87,556 |
| 2020 | 75,653 | 80,159 | 81,266 | 74,833 | 66,694 | 65,742 | 69,475 | 70,793 | 67,134 | 68,685 | 72,313 | 79,887 |
| 2021 | 79,025 | 70,600 | 81,930 | 69,501 | 71,487 | 81,182 | 74,881 | 74,174 | 74,977 | 75,220 | 80,835 | 87,075 |
| 2022 | 84,256 | 72,229 | 84,977 | 73,943 | 75,869 | 74,641 | 73,223 | 81,312 | 75,633 | 78,178 | 78,595 | 74,976 |
| 2023 | 87,704 | 84,027 | 86,683 | 77,753 | 89,428 | 80,945 | 81,730 | 90,936 | 81,311 | 84,300 | 94,036 | 87,311 |
| 2024 | 95,570 | |||||||||||
| - = No Data Reported; -- = Not Applicable; NA = Not Available; W = Withheld to avoid disclosure of individual company data. |
| Release Date: 3/29/2024 |
| Next Release Date: 4/30/2024 |