|
Download Data (XLS File) |
|
||||||||
|
||||||||
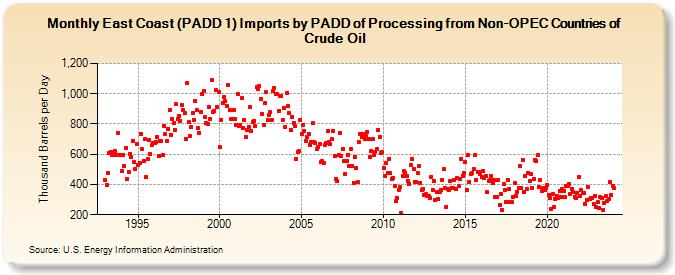
| East Coast (PADD 1) Imports by PADD of Processing from Non-OPEC Countries of Crude Oil (Thousand Barrels per Day) | ||||||||
| Year | Jan | Feb | Mar | Apr | May | Jun | Jul | Aug | Sep | Oct | Nov | Dec |
|---|---|---|---|---|---|---|---|---|---|---|---|---|
| 1993 | 427 | 399 | 475 | 609 | 614 | 598 | 595 | 624 | 592 | 738 | 597 | 596 |
| 1994 | 487 | 596 | 521 | 641 | 437 | 485 | 602 | 580 | 688 | 549 | 503 | 667 |
| 1995 | 531 | 545 | 734 | 633 | 557 | 698 | 452 | 567 | 691 | 601 | 660 | 674 |
| 1996 | 675 | 682 | 715 | 591 | 689 | 685 | 594 | 786 | 735 | 690 | 766 | 892 |
| 1997 | 728 | 834 | 806 | 763 | 932 | 832 | 853 | 821 | 925 | 890 | 873 | 703 |
| 1998 | 1,071 | 810 | 720 | 783 | 870 | 825 | 955 | 892 | 775 | 742 | 878 | 996 |
| 1999 | 1,017 | 843 | 806 | 802 | 909 | 831 | 1,088 | 879 | 886 | 1,024 | 915 | 1,012 |
| 2000 | 646 | 827 | 938 | 976 | 951 | 918 | 1,055 | 891 | 836 | 830 | 894 | 834 |
| 2001 | 791 | 1,000 | 787 | 790 | 969 | 773 | 823 | 717 | 761 | 780 | 912 | 754 |
| 2002 | 814 | 821 | 787 | 1,045 | 1,030 | 1,049 | 965 | 865 | 793 | 938 | 1,011 | 829 |
| 2003 | 861 | 876 | 823 | 1,018 | 1,038 | 998 | 995 | 883 | 983 | 982 | 828 | 907 |
| 2004 | 783 | 1,004 | 920 | 874 | 763 | 845 | 808 | 787 | 571 | 617 | 618 | 829 |
| 2005 | 733 | 794 | 754 | 688 | 714 | 736 | 661 | 681 | 807 | 681 | 675 | 633 |
| 2006 | 645 | 666 | 546 | 553 | 542 | 663 | 672 | 756 | 678 | 665 | 702 | 756 |
| 2007 | 586 | 438 | 420 | 594 | 741 | 586 | 633 | 553 | 471 | 555 | 598 | 525 |
| 2008 | 635 | 523 | 412 | 583 | 510 | 414 | 683 | 733 | 711 | 734 | 701 | 721 |
| 2009 | 748 | 701 | 579 | 618 | 702 | 594 | 614 | 633 | 759 | 715 | 611 | 612 |
| 2010 | 509 | 456 | 543 | 473 | 571 | 475 | 439 | 445 | 387 | 290 | 308 | 363 |
| 2011 | 381 | 211 | 456 | 488 | 478 | 457 | 422 | 406 | 526 | 570 | 499 | 416 |
| 2012 | 417 | 474 | 519 | 411 | 362 | 373 | 329 | 334 | 325 | 326 | 311 | 452 |
| 2013 | 362 | 422 | 296 | 348 | 301 | 349 | 366 | 430 | 499 | 375 | 254 | 373 |
| 2014 | 365 | 424 | 376 | 375 | 428 | 373 | 441 | 391 | 437 | 568 | 458 | 477 |
| 2015 | 547 | 361 | 593 | 417 | 468 | 476 | 501 | 592 | 428 | 484 | 482 | 471 |
| 2016 | 451 | 492 | 444 | 453 | 348 | 424 | 429 | 455 | 411 | 427 | 318 | 319 |
| 2017 | 430 | 266 | 340 | 233 | 403 | 362 | 286 | 431 | 368 | 283 | 282 | 318 |
| 2018 | 407 | 326 | 353 | 376 | 522 | 376 | 565 | 351 | 456 | 369 | 479 | 420 |
| 2019 | 470 | 377 | 436 | 564 | 557 | 593 | 381 | 427 | 359 | 375 | 364 | 376 |
| 2020 | 399 | 333 | 310 | 241 | 339 | 251 | 303 | 327 | 312 | 358 | 320 | 373 |
| 2021 | 359 | 314 | 388 | 393 | 401 | 337 | 369 | 350 | 320 | 313 | 345 | 447 |
| 2022 | 322 | 364 | 342 | 345 | 270 | 294 | 383 | 303 | 313 | 311 | 269 | 326 |
| 2023 | 251 | 282 | 245 | 318 | 312 | 233 | 279 | 324 | 292 | 307 | 416 | 333 |
| 2024 | 393 | |||||||||||
| - = No Data Reported; -- = Not Applicable; NA = Not Available; W = Withheld to avoid disclosure of individual company data. |
| Release Date: 3/29/2024 |
| Next Release Date: 4/30/2024 |