|
Download Data (XLS File) |
|
||||||||
|
||||||||
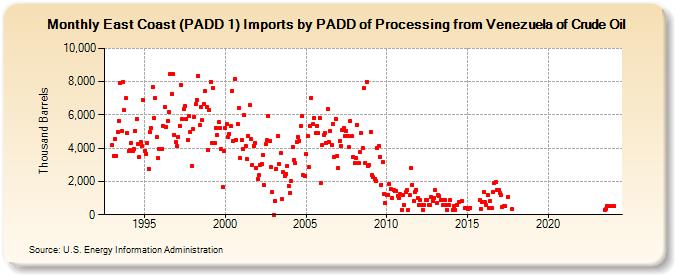
| East Coast (PADD 1) Imports by PADD of Processing from Venezuela of Crude Oil (Thousand Barrels) | ||||||||
| Year | Jan | Feb | Mar | Apr | May | Jun | Jul | Aug | Sep | Oct | Nov | Dec |
|---|---|---|---|---|---|---|---|---|---|---|---|---|
| 1993 | 4,164 | 3,556 | 4,580 | 3,532 | 4,971 | 5,660 | 7,934 | 5,018 | 7,987 | 6,280 | 6,993 | 4,903 |
| 1994 | 3,840 | 3,886 | 4,298 | 3,823 | 3,938 | 5,050 | 5,760 | 4,261 | 3,442 | 4,374 | 4,128 | 6,874 |
| 1995 | 3,855 | 3,638 | 4,304 | 2,770 | 4,953 | 5,191 | 7,689 | 5,787 | 7,008 | 4,684 | 3,399 | 3,955 |
| 1996 | 3,959 | 3,949 | 5,332 | 6,452 | 5,263 | 5,623 | 6,187 | 8,441 | 7,282 | 8,474 | 4,814 | 4,371 |
| 1997 | 4,116 | 4,690 | 5,331 | 7,823 | 5,728 | 6,354 | 6,514 | 5,737 | 4,489 | 5,939 | 4,980 | 2,934 |
| 1998 | 5,150 | 5,896 | 6,635 | 6,900 | 8,359 | 5,378 | 6,502 | 5,688 | 6,641 | 7,444 | 6,475 | 3,903 |
| 1999 | 6,282 | 7,968 | 4,313 | 7,626 | 4,325 | 5,226 | 4,800 | 5,551 | 5,189 | 3,921 | 1,643 | 3,833 |
| 2000 | 5,218 | 5,430 | 4,674 | 4,876 | 5,310 | 7,461 | 4,454 | 8,167 | 4,511 | 5,452 | 6,437 | 3,435 |
| 2001 | 4,480 | 3,959 | 5,992 | 4,137 | 3,359 | 4,749 | 6,590 | 4,559 | 2,959 | 4,140 | 4,335 | 2,830 |
| 2002 | 2,146 | 2,363 | 3,014 | 3,020 | 3,578 | 1,765 | 4,229 | 4,471 | 5,943 | 4,451 | 2,850 | 1,374 |
| 2003 | 0 | 822 | 2,766 | 4,757 | 3,049 | 3,683 | 933 | 2,550 | 2,321 | 2,457 | 2,956 | 1,743 |
| 2004 | 1,324 | 2,006 | 4,081 | 3,291 | 3,080 | 4,401 | 4,684 | 4,440 | 5,307 | 5,958 | 2,371 | 2,333 |
| 2005 | 3,632 | 4,719 | 2,851 | 5,346 | 7,044 | 5,433 | 5,808 | 4,898 | 5,359 | 4,914 | 5,838 | 1,902 |
| 2006 | 4,199 | 4,803 | 4,926 | 4,310 | 6,348 | 4,347 | 5,012 | 4,180 | 5,473 | 3,479 | 5,760 | 3,532 |
| 2007 | 2,799 | 4,410 | 4,132 | 5,090 | 5,226 | 4,737 | 5,062 | 4,761 | 4,047 | 5,643 | 4,710 | 3,482 |
| 2008 | 3,095 | 3,411 | 5,424 | 3,115 | 3,798 | 4,896 | 3,994 | 7,589 | 3,131 | 8,003 | 2,928 | 3,017 |
| 2009 | 4,973 | 2,369 | 2,249 | 2,155 | 2,030 | 4,040 | 4,135 | 3,487 | 1,809 | 3,148 | 1,271 | 701 |
| 2010 | 1,177 | 1,193 | 1,830 | 1,537 | 1,004 | 1,498 | 1,418 | 1,424 | 1,146 | 979 | 1,224 | 291 |
| 2011 | 1,172 | 581 | 1,341 | 1,498 | 290 | 1,160 | 2,835 | 1,812 | 808 | 1,391 | 1,512 | 1,002 |
| 2012 | 606 | 904 | 609 | 298 | 593 | 887 | 886 | 602 | 565 | 1,084 | 834 | 1,002 |
| 2013 | 1,457 | 703 | 1,188 | 1,099 | 868 | 871 | 580 | 892 | 597 | 304 | 593 | 867 |
| 2014 | 289 | 548 | 305 | 599 | 784 | 816 | 401 | 409 | ||||
| 2015 | 361 | 404 | 864 | 372 | 756 | |||||||
| 2016 | 1,352 | 737 | 566 | 1,202 | 430 | 848 | 389 | 1,362 | 1,915 | 1,974 | 1,486 | 1,492 |
| 2017 | 1,310 | 1,169 | 476 | 499 | 513 | 1,071 | 328 | |||||
| 2023 | 312 | 344 | 498 | 497 | ||||||||
| 2024 | 499 | |||||||||||
| - = No Data Reported; -- = Not Applicable; NA = Not Available; W = Withheld to avoid disclosure of individual company data. |
| Release Date: 3/29/2024 |
| Next Release Date: 4/30/2024 |