|
Download Data (XLS File) |
|
||||||||
|
||||||||
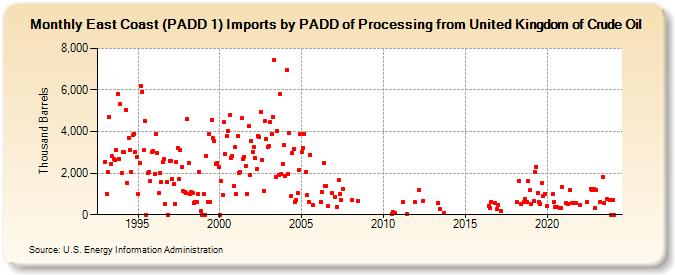
| East Coast (PADD 1) Imports by PADD of Processing from United Kingdom of Crude Oil (Thousand Barrels) | ||||||||
| Year | Jan | Feb | Mar | Apr | May | Jun | Jul | Aug | Sep | Oct | Nov | Dec |
|---|---|---|---|---|---|---|---|---|---|---|---|---|
| 1993 | 2,539 | 1,009 | 2,046 | 4,695 | 2,435 | 2,811 | 2,682 | 2,622 | 3,114 | 5,823 | 2,670 | 5,326 |
| 1994 | 1,997 | 3,003 | 2,999 | 5,053 | 1,542 | 3,705 | 3,108 | 2,052 | 3,811 | 3,899 | 3,010 | 2,757 |
| 1995 | 995 | 2,494 | 6,211 | 5,906 | 3,098 | 4,510 | 0 | 1,985 | 2,053 | 1,604 | 2,998 | 3,051 |
| 1996 | 1,952 | 3,875 | 2,964 | 1,042 | 2,000 | 1,576 | 2,517 | 2,665 | 506 | 1,570 | 0 | 2,599 |
| 1997 | 2,593 | 1,712 | 1,488 | 531 | 2,555 | 3,219 | 1,694 | 3,109 | 2,288 | 1,136 | 1,101 | 1,048 |
| 1998 | 4,617 | 2,500 | 1,003 | 1,096 | 1,054 | 569 | 632 | 620 | 1,000 | 2,056 | 172 | 0 |
| 1999 | 999 | 0 | 2,805 | 624 | 3,905 | 618 | 4,569 | 3,668 | 3,534 | 2,427 | 2,505 | 2,292 |
| 2000 | 0 | 1,642 | 945 | 4,446 | 2,924 | 3,790 | 4,040 | 4,805 | 2,746 | 2,818 | 1,398 | 3,253 |
| 2001 | 988 | 3,799 | 2,019 | 2,050 | 4,630 | 2,665 | 2,800 | 2,362 | 1,008 | 4,246 | 1,890 | 3,566 |
| 2002 | 3,024 | 3,262 | 2,739 | 2,220 | 3,806 | 3,719 | 4,945 | 2,651 | 1,155 | 4,485 | 3,622 | 3,255 |
| 2003 | 3,282 | 4,471 | 3,859 | 4,688 | 7,461 | 1,826 | 4,015 | 1,922 | 5,795 | 1,967 | 2,445 | 3,342 |
| 2004 | 1,861 | 6,959 | 1,938 | 3,948 | 886 | 2,983 | 3,160 | 599 | 709 | 1,063 | 2,146 | 3,881 |
| 2005 | 3,008 | 3,232 | 3,902 | 2,032 | 929 | 626 | 2,887 | 462 | ||||
| 2006 | 618 | 1,088 | 2,482 | 1,385 | 1,379 | 400 | 1,050 | |||||
| 2007 | 835 | 350 | 1,656 | 1,001 | 717 | 1,235 | ||||||
| 2008 | 685 | 649 | ||||||||||
| 2010 | 57 | 125 | 63 | |||||||||
| 2011 | 604 | 57 | 594 | |||||||||
| 2012 | 1,205 | 682 | ||||||||||
| 2013 | 578 | 259 | 83 | |||||||||
| 2016 | 429 | 325 | 616 | 540 | 279 | |||||||
| 2017 | 488 | 157 | ||||||||||
| 2018 | 599 | 1,619 | 496 | 605 | 736 | 605 | 1,643 | 1,174 | ||||
| 2019 | 523 | 661 | 2,035 | 2,305 | 1,047 | 595 | 532 | 1,515 | 884 | 976 | ||
| 2020 | 399 | 1,000 | 629 | 357 | 353 | 325 | 338 | 1,354 | ||||
| 2021 | 566 | 503 | 1,178 | 544 | 553 | 546 | ||||||
| 2022 | 476 | 606 | 1,260 | 1,195 | 1,223 | 329 | ||||||
| 2023 | 1,198 | 625 | 1,795 | 554 | 735 | 698 | 10 | |||||
| 2024 | 687 | |||||||||||
| - = No Data Reported; -- = Not Applicable; NA = Not Available; W = Withheld to avoid disclosure of individual company data. |
| Release Date: 3/29/2024 |
| Next Release Date: 4/30/2024 |