|
Download Data (XLS File) |
|
||||||||
|
||||||||
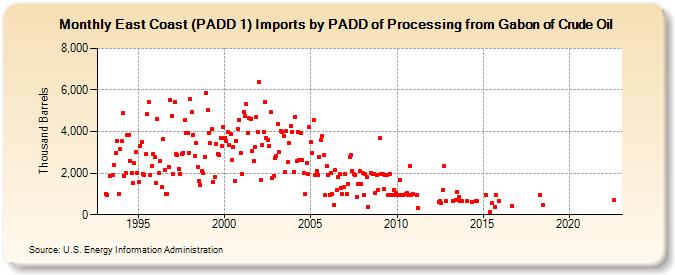
| East Coast (PADD 1) Imports by PADD of Processing from Gabon of Crude Oil (Thousand Barrels) | ||||||||
| Year | Jan | Feb | Mar | Apr | May | Jun | Jul | Aug | Sep | Oct | Nov | Dec |
|---|---|---|---|---|---|---|---|---|---|---|---|---|
| 1993 | 996 | 928 | 1,853 | 1,907 | 2,390 | 2,984 | 3,535 | 1,000 | 3,152 | |||
| 1994 | 3,546 | 4,892 | 1,886 | 2,012 | 3,849 | 3,855 | 2,576 | 1,999 | 1,535 | 2,472 | 3,001 | 2,008 |
| 1995 | 1,582 | 3,324 | 3,487 | 1,973 | 1,931 | 2,900 | 4,866 | 5,402 | 1,925 | 2,321 | 2,917 | 2,789 |
| 1996 | 1,516 | 4,606 | 1,988 | 2,581 | 1,331 | 3,652 | 2,156 | 1,006 | 1,003 | 2,313 | 5,532 | 4,765 |
| 1997 | 1,935 | 5,403 | 2,928 | 2,850 | 2,191 | 1,971 | 2,904 | 2,985 | 4,560 | 3,925 | 3,912 | 2,986 |
| 1998 | 5,572 | 4,920 | 3,834 | 2,823 | 3,469 | 2,308 | 1,609 | 1,449 | 2,094 | 2,003 | 2,754 | 5,857 |
| 1999 | 5,057 | 3,948 | 3,440 | 4,107 | 1,572 | 1,803 | 3,389 | 2,931 | 2,877 | 3,686 | 3,310 | 4,233 |
| 2000 | 3,702 | 3,544 | 3,961 | 3,341 | 3,869 | 2,625 | 3,256 | 1,612 | 3,561 | 4,146 | 4,576 | 2,957 |
| 2001 | 1,954 | 4,949 | 4,726 | 5,307 | 3,936 | 4,658 | 4,613 | 3,045 | 2,582 | 3,272 | 4,716 | 3,990 |
| 2002 | 6,383 | 1,681 | 3,365 | 4,000 | 5,424 | 3,676 | 3,611 | 3,317 | 4,923 | 1,745 | 1,876 | 2,727 |
| 2003 | 2,848 | 4,376 | 3,031 | 4,039 | 4,000 | 3,780 | 2,034 | 4,030 | 2,535 | 3,428 | 4,247 | 3,995 |
| 2004 | 2,063 | 4,714 | 2,581 | 3,986 | 2,634 | 3,928 | 2,646 | 2,023 | 1,005 | 2,505 | 1,962 | 4,211 |
| 2005 | 3,506 | 2,956 | 4,576 | 1,915 | 2,110 | 1,912 | 2,780 | 3,591 | 3,791 | 2,849 | 932 | 2,337 |
| 2006 | 1,887 | 945 | 2,005 | 981 | 452 | 2,132 | 1,181 | 1,792 | 1,969 | 1,291 | 985 | 1,317 |
| 2007 | 1,954 | 1,006 | 1,499 | 2,759 | 2,884 | 2,119 | 1,964 | 1,917 | 856 | 1,474 | 2,090 | 1,475 |
| 2008 | 2,007 | 957 | 1,952 | 1,824 | 351 | 2,009 | 1,962 | 1,978 | 1,028 | 1,918 | 1,209 | |
| 2009 | 3,666 | 1,966 | 1,935 | 1,227 | 1,918 | 1,903 | 960 | 1,979 | 956 | 960 | 1,211 | 1,037 |
| 2010 | 955 | 960 | 1,679 | 958 | 959 | 995 | 1,052 | 957 | 2,339 | 957 | 998 | |
| 2011 | 958 | 300 | ||||||||||
| 2012 | 600 | 648 | 570 | 1,199 | 2,323 | 650 | ||||||
| 2013 | 650 | 716 | 1,102 | 847 | 649 | 648 | ||||||
| 2014 | 648 | 620 | 650 | 649 | ||||||||
| 2015 | 951 | 108 | 554 | 350 | 947 | 668 | ||||||
| 2016 | 439 | |||||||||||
| 2018 | 945 | 452 | ||||||||||
| 2022 | 708 | |||||||||||
| - = No Data Reported; -- = Not Applicable; NA = Not Available; W = Withheld to avoid disclosure of individual company data. |
| Release Date: 3/29/2024 |
| Next Release Date: 4/30/2024 |