|
Download Data (XLS File) |
|
||||||||
|
||||||||
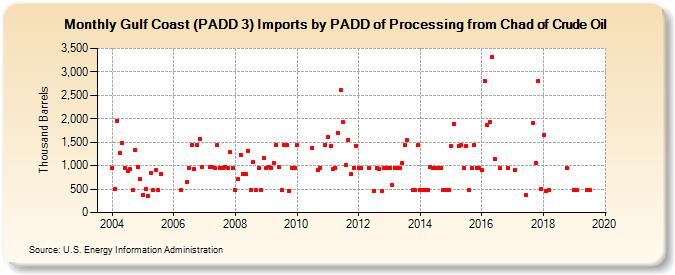
| Gulf Coast (PADD 3) Imports by PADD of Processing from Chad of Crude Oil (Thousand Barrels) | ||||||||
| Year | Jan | Feb | Mar | Apr | May | Jun | Jul | Aug | Sep | Oct | Nov | Dec |
|---|---|---|---|---|---|---|---|---|---|---|---|---|
| 2004 | 941 | 500 | 1,962 | 1,263 | 1,485 | 958 | 892 | 926 | 471 | 1,343 | 976 | 706 |
| 2005 | 385 | 494 | 360 | 835 | 476 | 899 | 479 | 825 | ||||
| 2006 | 478 | 643 | 951 | 1,440 | 929 | 1,439 | 1,576 | 961 | ||||
| 2007 | 961 | 964 | 955 | 1,435 | 956 | 957 | 963 | 960 | 1,288 | 956 | ||
| 2008 | 478 | 711 | 1,235 | 813 | 827 | 1,318 | 481 | 1,079 | 475 | 940 | 473 | 1,160 |
| 2009 | 958 | 962 | 960 | 1,060 | 1,437 | 967 | 474 | 1,439 | 1,436 | 468 | 943 | 954 |
| 2010 | 1,430 | 1,387 | 906 | 957 | 1,449 | |||||||
| 2011 | 1,617 | 1,421 | 932 | 955 | 1,700 | 2,618 | 1,923 | 1,006 | 1,556 | 827 | 955 | 1,429 |
| 2012 | 952 | 952 | 950 | 467 | 942 | 931 | 453 | 952 | 953 | |||
| 2013 | 956 | 590 | 956 | 951 | 955 | 1,067 | 1,430 | 1,546 | 476 | 476 | 1,430 | |
| 2014 | 477 | 471 | 483 | 490 | 967 | 956 | 947 | 954 | 952 | 476 | 474 | 474 |
| 2015 | 1,427 | 1,898 | 1,419 | 1,432 | 952 | 1,423 | 477 | 949 | 1,440 | 950 | 949 | |
| 2016 | 907 | 2,809 | 1,875 | 1,926 | 3,315 | 1,146 | 953 | 947 | ||||
| 2017 | 902 | 378 | 1,902 | 1,066 | 2,809 | 501 | ||||||
| 2018 | 1,646 | 470 | 483 | 955 | ||||||||
| 2019 | 477 | 472 | 476 | 476 | ||||||||
| - = No Data Reported; -- = Not Applicable; NA = Not Available; W = Withheld to avoid disclosure of individual company data. |
| Release Date: 3/29/2024 |
| Next Release Date: 4/30/2024 |